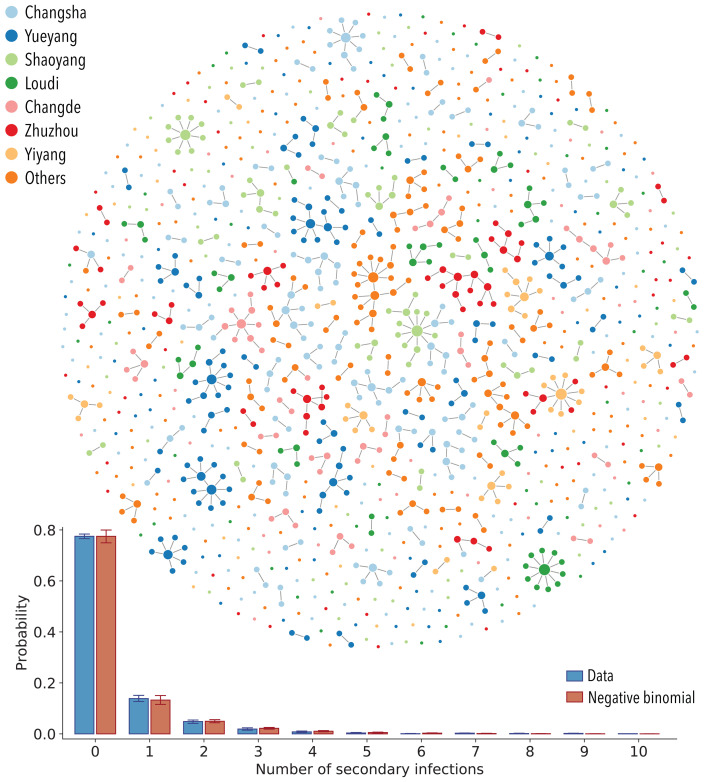
Fig. 1. SARS-CoV-2 transmission chains.
(Top) One realization of the reconstructed transmission chains among 1178 SARS-CoV-2–infected individuals in Hunan province. Each node in the network represents a patient infected with SARS-CoV-2, and each link represents an infector-infectee relationship. The color of the node denotes the reporting prefecture of the infected individuals. (Bottom) Distribution of the number of secondary infections. Blue bars represent the ensemble averaged across 100 stochastic samples of the reconstructed transmission chains. Orange bars represent the best fit of a negative binomial distribution to the ensemble average. Vertical lines indicate 95% CIs across 100 samples (of both data and the models’ fitting results). Some confidence intervals are narrow and not visible on the plot. For sensitivity analysis, we also fit the distribution with geometric and Poisson distributions. On the basis of the Akaike information criterion (AIC), the negative binomial distribution fit the data the best (average AIC score for negative binomial distribution: 1902; for geometric distribution: 1981; and for Poisson distribution: 2259).

