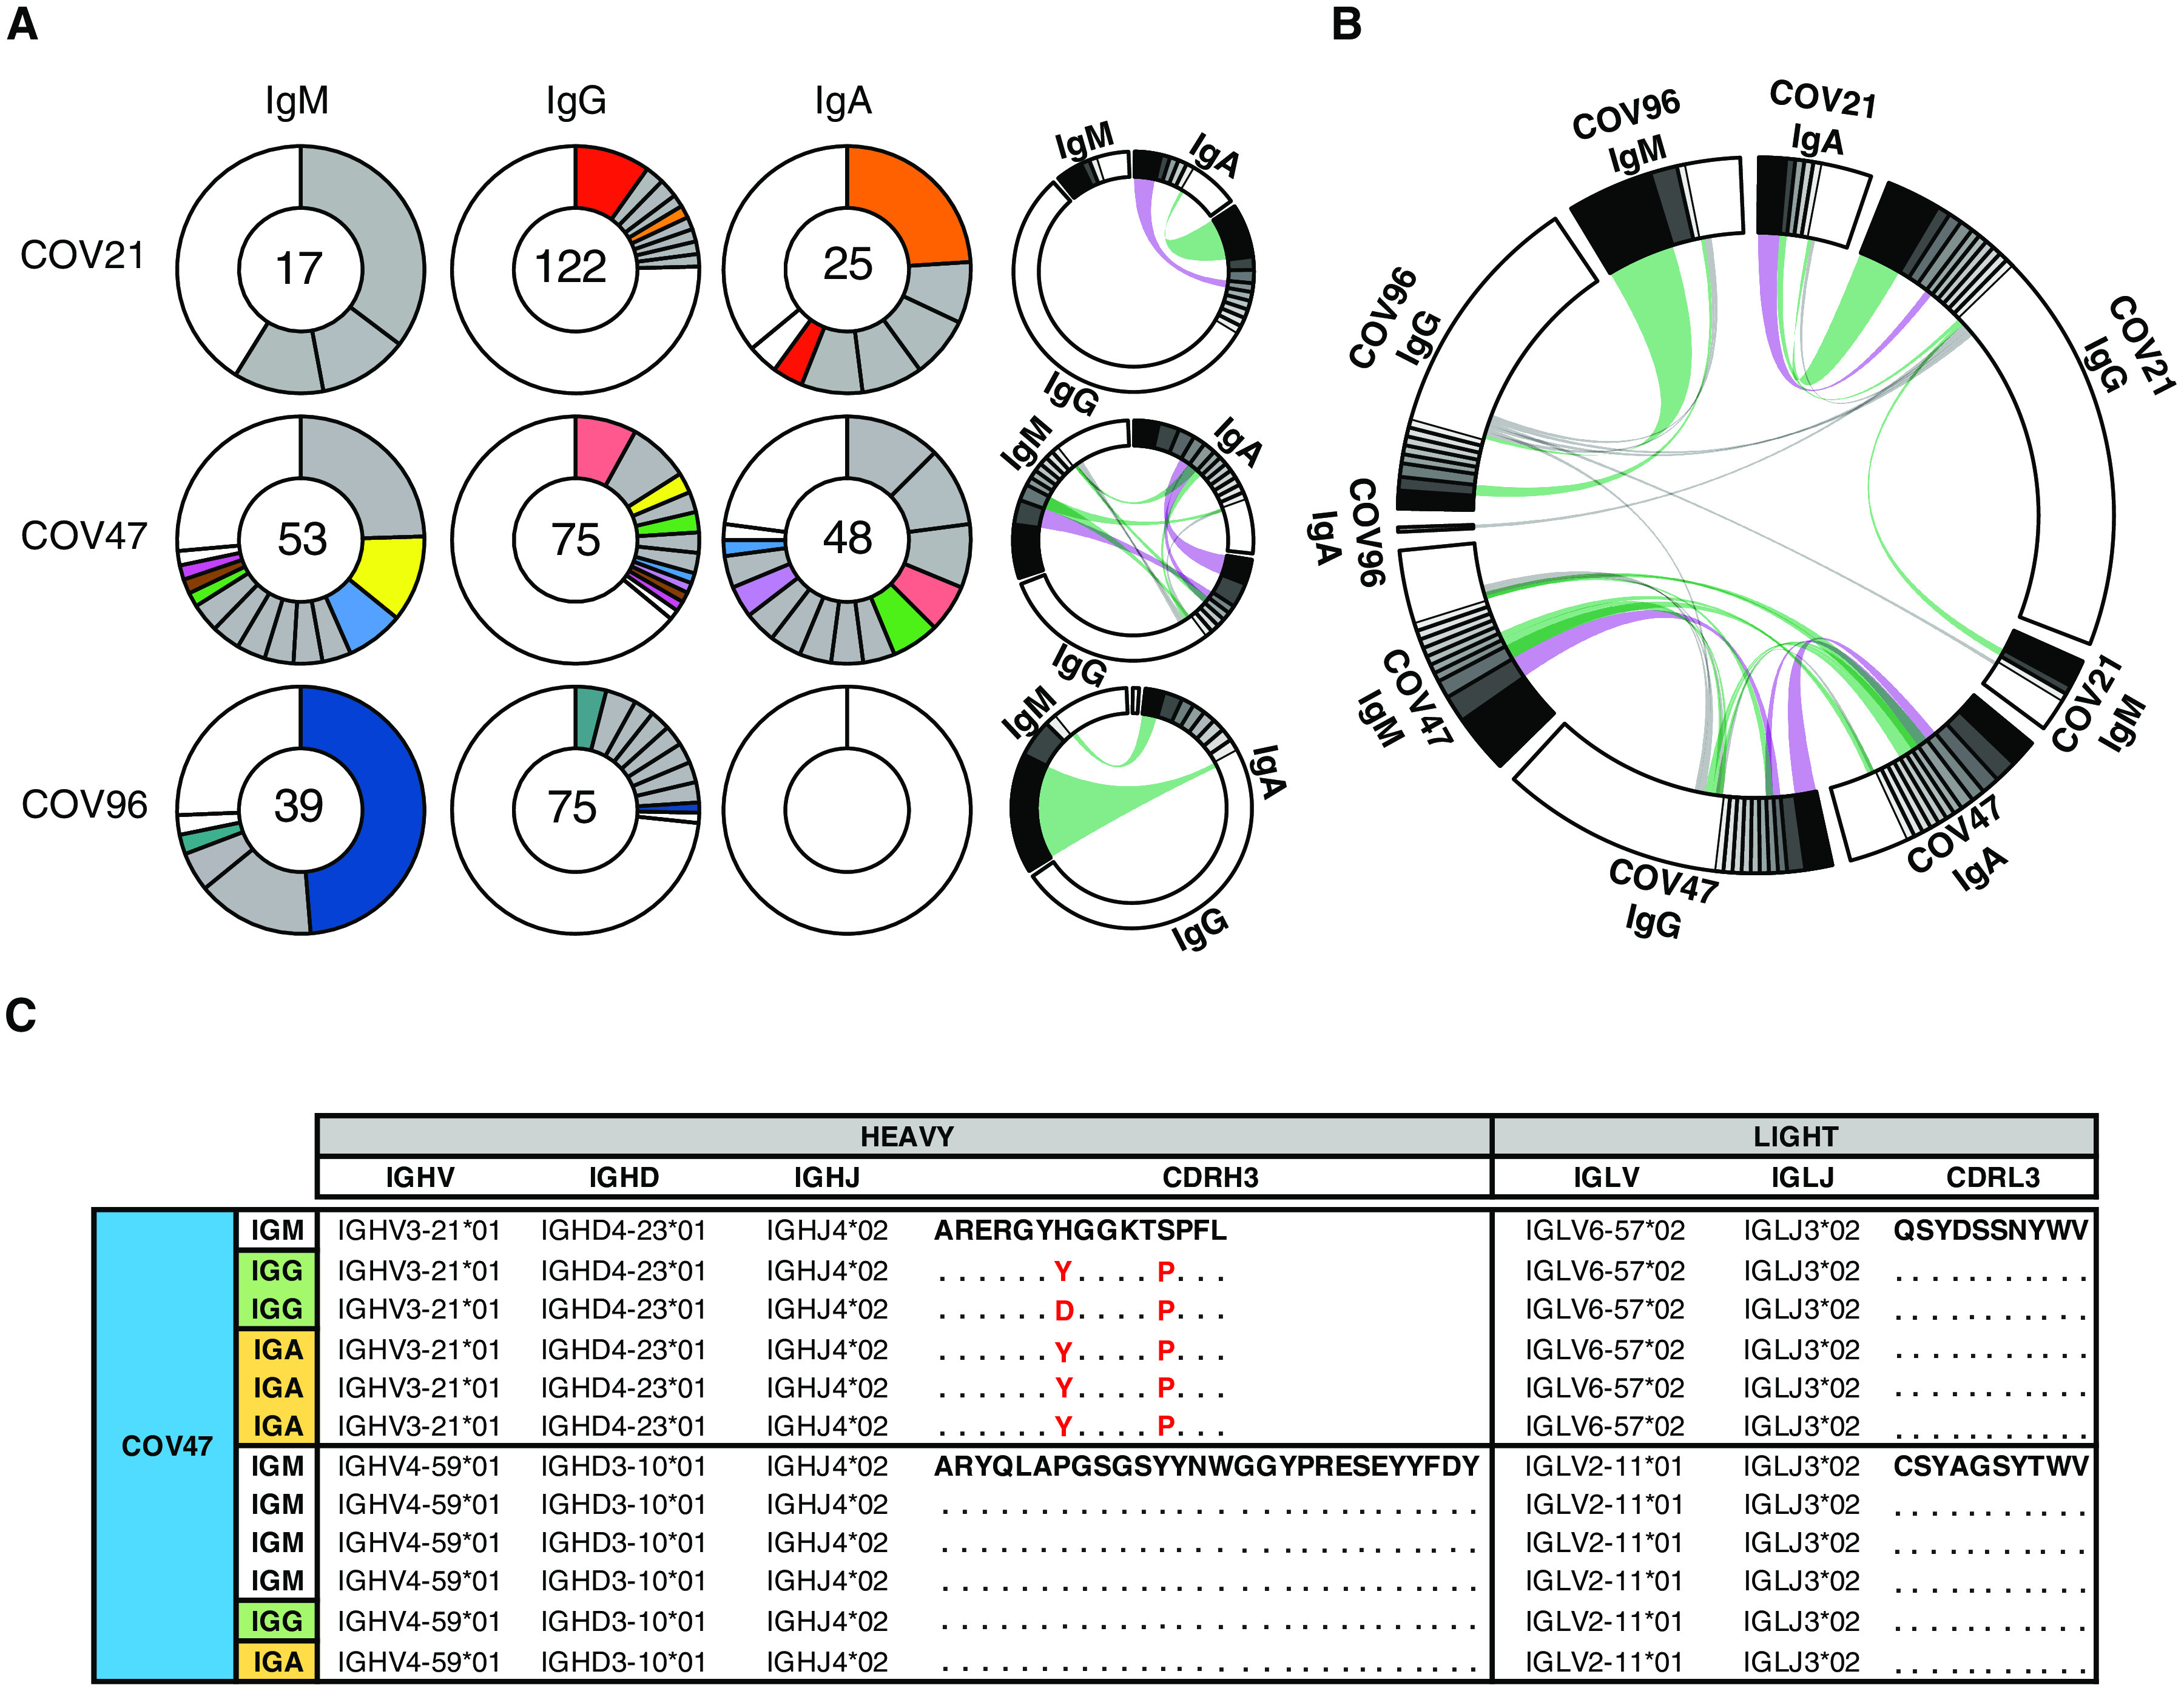
Fig. 4. Characterization of monoclonal anti–SARS-CoV-2 RBD IgM, IgG, and IgA antibodies.

(A) B cells producing IgM, IgG, and IgA from three individuals—COV21, COV47, and COV96—were analyzed, and clonality was evaluated. The number in the inner circle indicates the number of sequences analyzed for the individual denoted. Pie slice size is proportional to the number of clonally related sequences. Colored pie slices indicate clones or singlets that share the same IGHV and IGLV genes and have highly similar CDR3s across isotypes. Gray indicates clones that are not shared. White indicates singlets that are not shared. The right side circos plots show the relationship between antibodies of different isotypes that share the same IGH V(D)J and IGL VJ genes and have highly similar CDR3s. Purple, green, and gray lines connect related clones, clones and singles, and singles to each other, respectively. (B) Circos plot shows sequences from all three individuals with clonal relationships depicted as in (A). (C) Sample sequence alignment for antibodies of different isotypes isolated from individual COV47 that display the same IGH V(D)J and IGL VJ genes and highly similar CDR3s. Amino acid differences in CDR3s to the reference sequence (bold) are indicated in red, and dots represent identical amino acids.
