
Fig. 6. IgA dimers bind to RBD and neutralize authentic SARS-CoV-2 more potently than monomers in vitro.
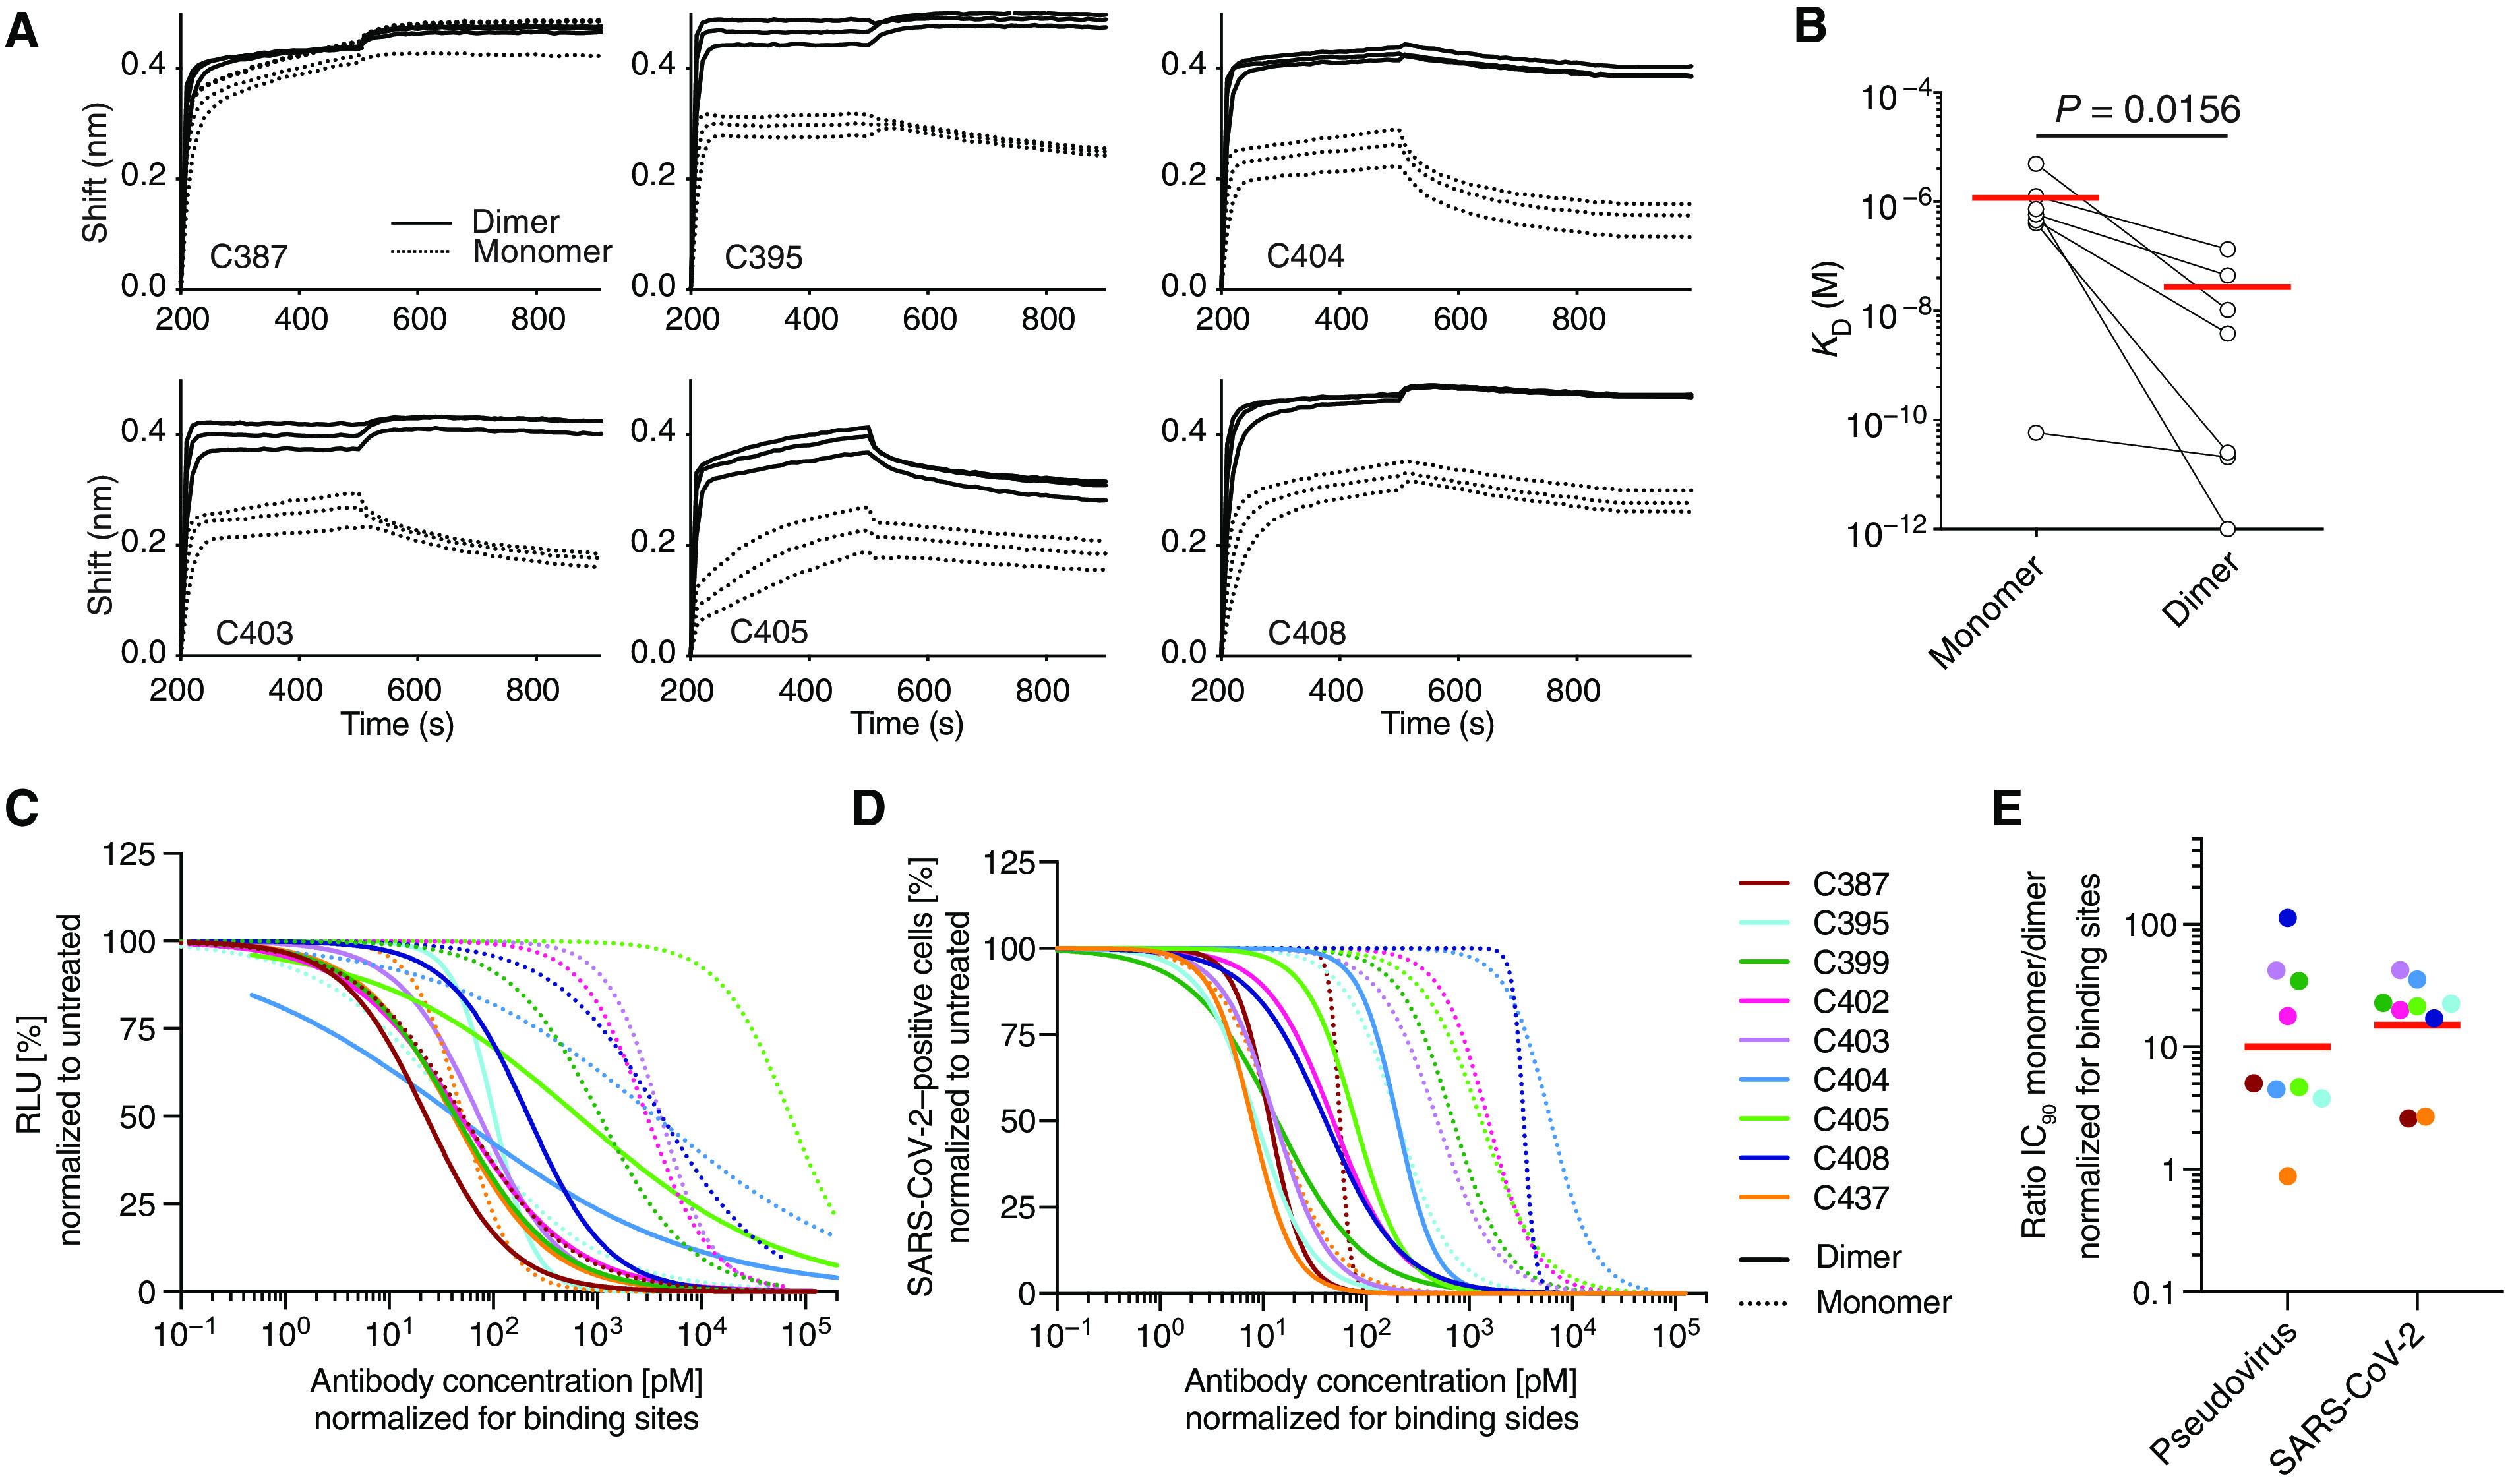
(A) Graphs depict binding affinity measurements of individual IgA monomers and corresponding dimers. (B) The dissociation constant (KD) values of monomers and dimers were compared. Horizontal lines indicate mean (n = 7). (C and D) Normalized relative luminescence values (RLU) for cell lysates of 293TACE2 cells after infection with SARS-CoV-2 pseudovirus (C) or normalized percentage of SARS-CoV-2–positive Vero E6 cells 48 hours after infection with SARS-CoV-2 authentic virus (D). Values obtained in the absence of antibody are plotted at x = 0.1 to be visible on a log scale in the presence of increasing concentrations of indicated monoclonal antibodies in their monomeric or dimeric form. Four-parameter nonlinear regression curve fits of normalized data are shown. (E) IC90 values were compared between monomer to dimers after normalization to number of antibody binding sites. For (B), Student’s t test was used.