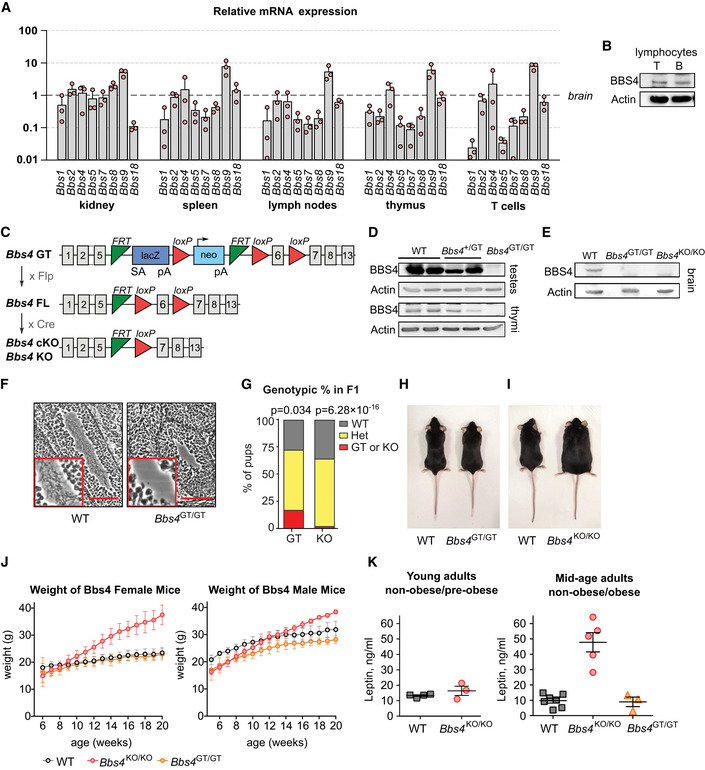
Figure 1. Basic characterization of Bbs4‐deficient mouse models.

- Relative expression of the BBSome subunits in the indicated organs and T cells measured by qPCR. C T values of the BBS genes were normalized to the geometric mean of the C T values of reference genes Gapdh, Tubb2a, and Eef1a1. The expression levels are normalized to those of brain (= 1). Mean + SD. Three biological replicates (the result of each biological replicate is a median of three technical replicates).
- Immunoblot analysis of BBS4 expression in T and B lymphocytes isolated from the lymph nodes and spleen of C57Bl/6 mouse. β‐actin staining served as a loading control. The identical immunoblot is shown in Fig EV4A. A representative experiment out of three biological replicates in total is shown.
- Schematic representation of mouse models of Bbs4 deficiency used in this study. Bbs4 GT, gene trap allele interrupting the Bbs4 gene. Bbs4 FL, allele with floxed Bbs4 exon 6. Bbs4 KO and cKO alleles with deleted exon 6.
- Immunoblot analysis of BBS4 expression in testes and thymi lysates of Bbs4 +/+ (WT), Bbs4 GT/+, and Bbs4 GT/GT mice. β‐actin staining serves as a loading control. A representative experiment out of three biological replicates in total is shown.
- Immunoblot analysis of BBS4 expression in the brain lysates of Bbs4 +/+, Bbs4 GT/GT, and Bbs4 KO/KO mice. β‐actin staining served as a loading control. A representative experiment out of two biological replicates is shown.
- Hematoxylin and eosin staining of sections of seminiferous tubules from ~ 4 weeks old Bbs4 +/+ (n = 2 mice) and Bbs4 GT/GT (n = 4) males. Scale bar, 100 µm. Representative images are shown.
- Genotypic ratio of Bbs4 +/+, Bbs4 GT/+ or Bbs4 KO/+ (Het), and Bbs4 GT/GT (GT) or Bbs4 KO/KO (KO) offspring at weaning from mating of Bbs4 GT/+ (n = 145 pups) or Bbs4 +/KO (n = 168 pups) parents. Binomial test was used for statistical comparison of the observed distribution to the expected Mendelian ratio.
- Bbs4 +/+ and Bbs4 GT/GT female littermates at 20 weeks of age. Representative litter out of seven in total.
- Bbs4 +/+ and Bbs4 KO/KO female littermates at 20 weeks of age. Representative litter out of five in total.
- Growth curves of Bbs4‐deficient mice, mean ± SD is shown. Females: Bbs4 +/+ (n = 12 mice), Bbs4 GT/GT (n = 12), Bbs4 KO/KO (n = 6). Males: Bbs4 +/+ (n = 6 mice), Bbs4 GT/GT (n = 7), Bbs4 KO/KO (n = 5).
- Leptin concentration in blood plasma taken from young adult (7–8 weeks) or mid‐age (14–20 weeks) mice. Young adult mice: Bbs4 +/+ (n = 4 mice), Bbs4 KO/KO (n = 3), analyzed in two independent experiments. Mid‐age adult mice: Bbs4 +/+ (n = 7 mice), Bbs4 KO/KO (n = 5), Bbs4 GT/GT (n = 3), analyzed in 4 independent experiments. Kruskal–Wallis tests were used for the statistical analysis. Mean ± SEM.
Source data are available online for this figure.
