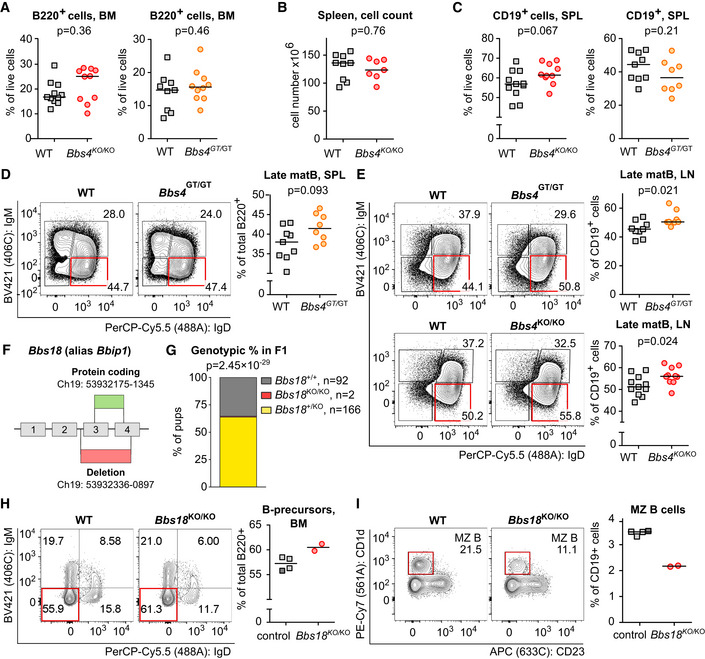
Figure EV3. Bbs4 deficiency in mice leads to B‐cell compartment alterations.

-
APercentage of B220+ cells in the bone marrow (BM) of Bbs4 GT/GT (n = 10 mice), Bbs4 KO/KO (n = 10) and their Bbs4 +/+ (WT) littermates (n = 9, n = 11, respectively) was determined by flow cytometry. For Bbs4 GT strain, a representative experiment out of six in total is shown. For Bbs4 KO strain, a representative experiment out of eight in total is shown. Statistical significance was calculated using two‐tailed Mann–Whitney test. Medians are shown.
-
BSplenocyte count in Bbs4 +/+ (n = 9 mice) and Bbs4 KO/KO (n = 7) mice. Medians are shown. Statistical significance was calculated using two‐tailed Mann–Whitney test.
-
CPercentage of B cells (CD19+) in the spleen (SPL) of Bbs4 GT/GT (n = 8 mice), Bbs4 KO/KO (n = 10) and their Bbs4 +/+ littermates (n = 9 and n = 11, respectively) was determined. Six independent experiments for Bbs4 GT/GT and eight experiments for Bbs4 KO/KO were performed. Statistical significance was calculated using two‐tailed Mann–Whitney test. Medians are shown.
-
DPercentage of splenic (SPL) late mature (IgM− IgD+) B cells (Late matB) among viable CD19+ cells in Bbs4 +/+ (n = 9 mice) and Bbs4 GT/GT (n = 8) mice. Representative experiment out of six in total is shown. Statistical significance was calculated using two‐tailed Mann–Whitney test. Medians are shown.
-
EPercentage of late mature (IgM− IgD+) B cells (Late matB) among viable CD19+ cells in lymph nodes (LN) from Bbs4 GT/GT (n = 8 mice) and Bbs4 +/+ littermates (n = 9), or Bbs4 KO/KO (n = 10) mice and Bbs4 +/+ controls (n = 11). Representative experiments are shown. Statistical significance was calculated using two‐tailed Mann–Whitney test. Medians are shown.
-
FSchematic representation of the Bbs18 KO mouse model. Bbs18 reference sequence: ENSMUSG00000084957 (Ensembl database).
-
GGenotypic ratio of Bbs18 +/+, Bbs18 +/KO, or Bbs18 KO/KO at weaning from mating of Bbs18 +/ KO parents. Binomial test was used for statistical comparison of the observed distribution to the expected Mendelian ratio.
-
H, IComparison of Bbs18 KO/KO mice (n = 2 mice) mice with pooled Bbs18 +/+ (n = 1, dark gray square) and Bbs18 +/KO (n = 3, light gray square) controls. All six mice were littermates and were analyzed side by side in a single experiment. (H) Percentage of B‐cell precursors (IgM− IgD−) in the bone marrow (BM). Gated on viable B220+ cells. Medians are shown. (I) Percentage of splenic MZ B cells (CD23− CD1d+) in Bbs18 KO/KO mice and their control littermates was determined. Gated on viable CD19+, IgD− IgM+, CD138− cells. Medians are shown.
Source data are available online for this figure.
