
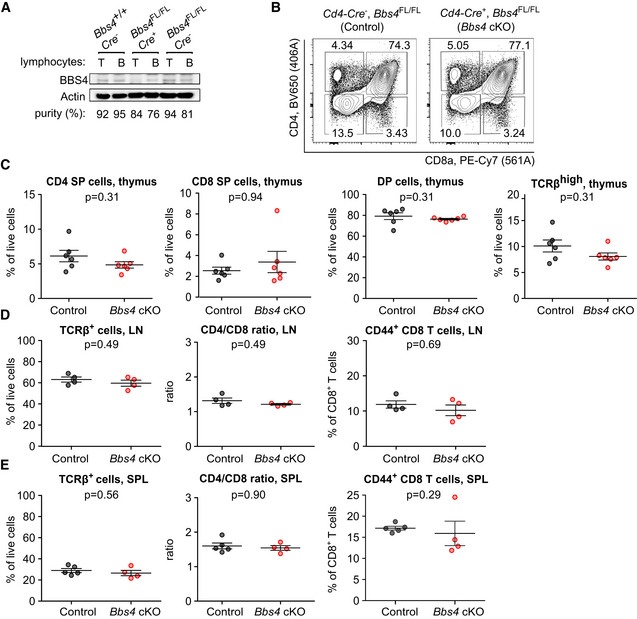
Figure EV4. BBS4 has no intrinsic role in T‐cell development.
-
AThe immunoblot analysis of the BBS4 expression in enriched T or B cells taken from lymph nodes and spleens of Bbs4 +/+ Cd4‐Cre − , Bbs4 FL/FL Cd4‐Cre +, and Bbs4 FL/FL Cd4‐Cre − mice. The purity of the enriched populations is indicated. β‐actin staining served as a loading control. Part of the identical immunoblot is shown in Fig 1B. A representative experiment out of three biological replicates in total is shown.
-
B–ECells isolated from thymi (B, C), lymph nodes (LN) (D), and spleens (SPL) (E) of Bbs4 FL/FL Cd4‐Cre + (Bbs4 cKO) mice were analyzed by flow cytometry. Bbs4 +/+ Cd4‐Cre + and Bbs4 FL/FL Cd4‐Cre − mice were used as controls interchangeably. (B, C) Thymic cell populations: CD4 single‐positive (SP) (CD4+, CD8−), CD8 SP (CD4− CD8+), double‐positive (DP) (CD4+ CD8+), TCRβhigh cells. n = 6 mice per group, four independent experiments. Mean ± SEM, two‐tailed Mann–Whitney test. (D) T‐cell populations in lymph nodes, n = 4 mice per group, three independent experiments. Mean ± SEM, two‐tailed Mann–Whitney test. (E) T‐cell populations in spleens of control (n = 5 mice) and Bbs4 cKO (n = 4), analyzed in three independent experiments. Mean ± SEM, two‐tailed Mann–Whitney test.
Source data are available online for this figure.