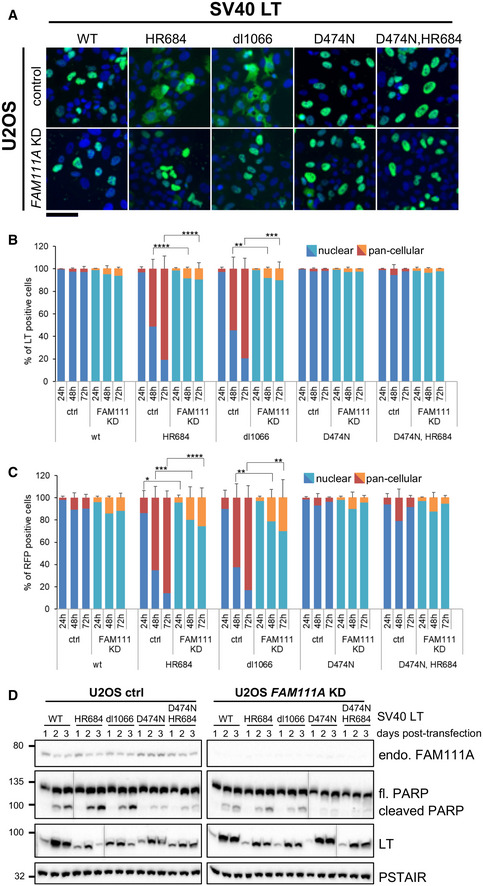
Representative immunofluorescence images of SV40 LT localization 72 h after transfection into U2OS cells infected with control or FAM111A shRNA. Images were taken with a Zeiss Axio Imager. LT is shown in green, and DAPI blue. Scale bar: 100 μm.
Quantification of LT‐positive cells described in (A) and fixed at indicated times post‐transfection. Five hundred or more cells were counted for each condition.
Quantification of RFP marker distribution upon cotransfection with SV40 LT variants into U2OS cells infected with control or FAM111A shRNA. Cells were fixed at the indicated times. Five hundred or more cells were counted for each condition.
Western blot analysis of control or FAM111A‐depleted U2OS cells transfected with SV40 LT variants. Cells were collected and lysed at indicated timepoints after SV40 transfection, immunoblotted with FAM111A, LT, or PARP antibodies. Cdc2‐PSTAIR was used as a loading control.
Data information: In (B, C) values are mean ± s.d. of independent experiments (
n = 3). *
P < 0.05, **
P < 0.01, ***
P < 0.001, ****
P < 0.0001 (two‐tailed unpaired
t‐test).

