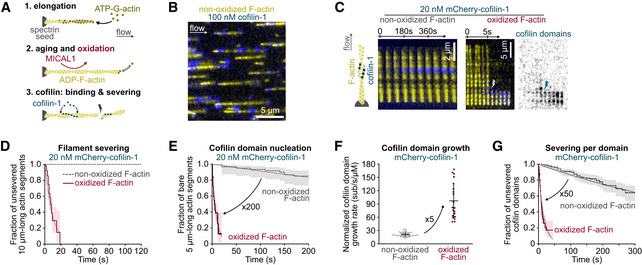
Figure 1. Cofilin at low concentration quickly binds and severs oxidized actin filament.

-
AThree steps of a typical experiment (see also Materials and Methods). Filaments are polymerized with 0.6–1 µM ATP‐G‐actin and aged for 15 min with ATP‐G‐actin at critical concentration (0.1 µM) to maintain the filament length. This solution is supplemented with MICAL1 and NADPH to oxidize filaments. Tpm can also be added at this step to fully decorate filaments (Figs 3 and 4).
-
BFraction (1/17th) of a typical field of view. In a microfluidic chamber, actin filaments (yellow) are anchored by their pointed ends and align with the flow.
-
CTime‐lapse images showing the assembly of cofilin‐1 domains (blue) and subsequent severing of actin filaments (yellow). The time‐lapse of an oxidized filament shows filament severing at 6 s; the first cofilin domain nucleation at 2 s; growth of four individual domains as their fluorescence intensity increases; and severing (lightning symbol) at the top domain, 2 s after its nucleation.
-
DGlobal measurement of the severing of filaments exposed to 20 nM mCherry‐cofilin‐1 from time t = 0 onwards. N = 20 (from one representative experiment) and 50 (1 experiment) for non‐oxidized and oxidized actin filaments, respectively. P‐value = 8 × 10⁻⁸ (log‐rank test).
-
ENucleation of the first cofilin domain onto 5 µm long actin segments. Filaments are exposed to 20 nM mCherry‐cofilin‐1 from time t = 0 onwards. N = 60 filaments, from one experiment for each condition. P‐value = 4 × 10⁻¹⁵ (log‐rank test).
-
FGrowth rate of single cofilin domains, normalized by the cofilin concentration. N = 50 (from three independent experiments) and 20 (1 experiment) domains on non‐oxidized and oxidized filaments, respectively. Measurements were obtained using 20 and 100 nM cofilin (non‐oxidized actin) and 10 nM cofilin (oxidized actin). Note that this normalized growth rate does not depend on the cofilin concentration (Appendix Fig S4A). Bars: mean and SD. P‐value = 7 × 10⁻⁸ (t‐test).
-
GFilament severing rate at single cofilin domains. Time t = 0 is defined for every domain as the frame on which they nucleate. N = 163 (from two independent experiments) and 203 (3 experiments) cofilin domains on non‐oxidized and oxidized actin filaments, respectively. Measurements were performed at 100 nM cofilin (non‐oxidized F‐actin) and 10, 20, or 30 nM cofilin (oxidized F‐actin). Since the severing rate does not depend on the cofilin concentration (Appendix Fig S4B and (Wioland et al, 2017, 2019a)), data for 10, 20, and 30 nM cofilin on oxidized filaments were pooled. Measurements on non‐oxidized filaments were done at 100 nM mCherry‐cofilin‐1. P‐value = 9 × 10−41 (log‐rank test).
Data information: (D, E, G) Thick solid and dashed lines are survival fractions calculated from the experimental data. Thin gray lines are single exponential fits. 95% confidence intervals are shown as shaded surfaces.
Source data are available online for this figure.
