
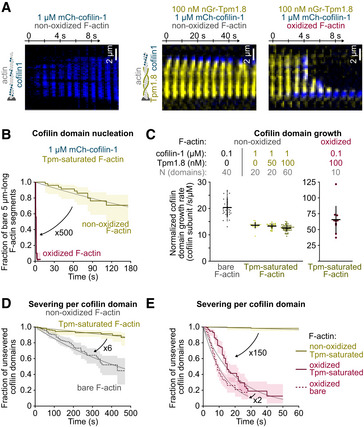
Figure 4. Tpm protects non‐oxidized but not oxidized F‐actin from cofilin‐induced severing.
-
ATime‐lapse images of filaments, oxidized or not, bare or Tpm‐saturated, exposed to 1 µM mCherry‐cofilin‐1, from time t = 0 onwards. Other examples are shown in Appendix Fig S6.
-
BNucleation of the first cofilin domain onto 5 µm long Tpm‐saturated actin filaments. Filaments are exposed to 1 µM mCherry‐cofilin from time t = 0 onwards. N = 50 filaments from one experiment for each condition. P‐value = 4× 10⁻¹⁵ (log‐rank test).
-
CGrowth rate of single cofilin domains, normalized by the cofilin concentration. Filaments saturated by Tpm during aging (Fig 1A) were then exposed to cofilin, along with 0–100 nM nGr‐Tpm1.8 to test the competition between the two soluble proteins. Note the scale difference for oxidized filaments. Bars: Mean and S.D. Number of experiments, first to last condition: 2, 1, 1, 3, and 1.
-
D, EFilament severing rate at single cofilin domains. Time t = 0 is defined for every domain as the frame on which they nucleate. N = 163 (2 experiments), 180 (4 experiments), 116 (3 experiments), 203 (3 experiments) domains for bare actin (100 nM mCherry‐cofilin‐1), non‐oxidized Tpm‐saturated (1 µM mCherry‐cofilin‐1), oxidized Tpm‐saturated filaments (100 nM mCherry‐cofilin‐1), and bare oxidized actin (10, 20, 30 nM mCherry‐cofilin‐1), respectively.
Data information: (B, D, E) Thick solid and dashed lines are survival fractions calculated from the experimental data. Thin gray lines are single exponential fits. 95% confidence intervals are shown as shaded surfaces.
Source data are available online for this figure.