
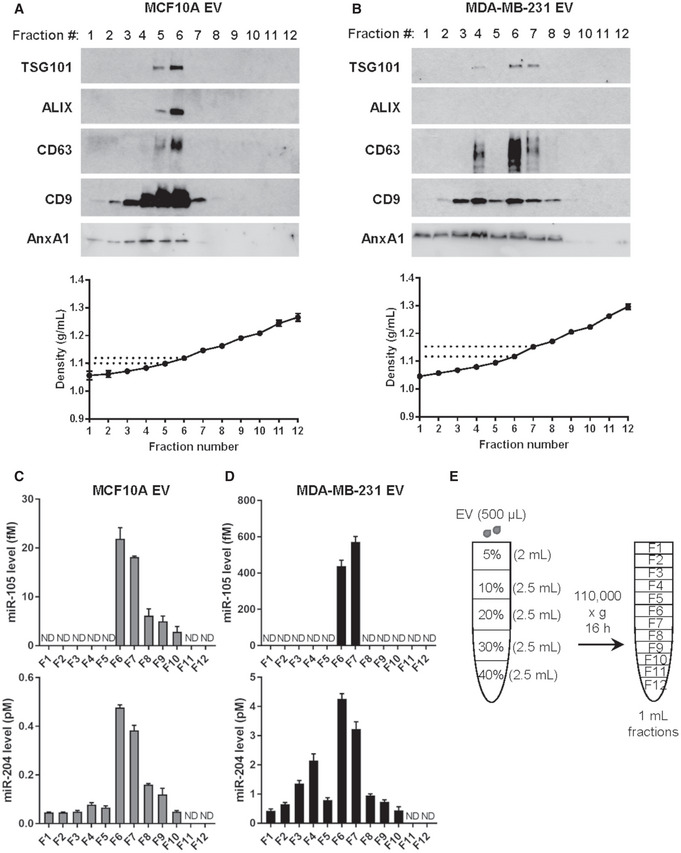
Figure EV2. EV characterization by density gradient fractionation.
-
A, BWestern blot and density measurement of EV fractions collected from indicated cell lines to detect EV markers.
-
C, DRT–qPCR of EV fractions collected from indicated cell lines to detect miR‐105 and miR‐204 levels (n = 3 biological replicates for each fraction). Data are presented as mean ± SD. ND: not detected.
-
EA schematic representation of the density gradient separation procedure to further characterize the 110,000 × g pellets.
Source data are available online for this figure.