
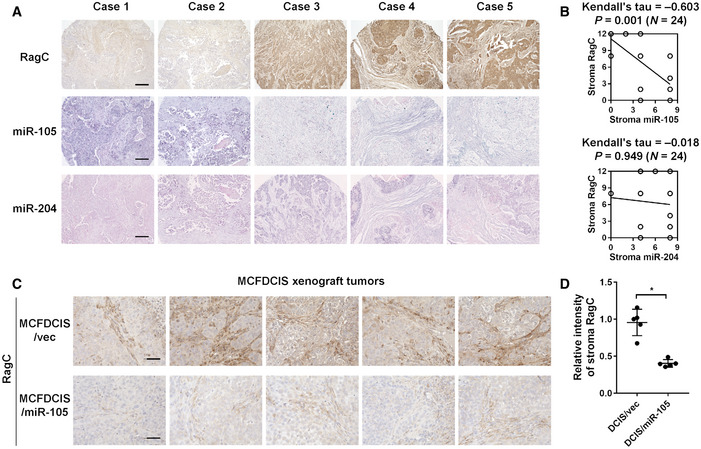
Figure 7. RAGC levels in tumor stroma are inversely correlated with miR‐105.
-
A, BA breast cancer tissue array was analyzed for correlations among RagC, miR‐105, and miR‐204 in tumor stroma by IHC/ISH‐determined scores. Representative IHC and ISH images (A) and correlations determined by Kendall’s tau correlation tests (N = 24 independent tumors; Kendall’s tau and two‐sided P value as indicated) (B) are shown. Bar = 200 μm.
-
C, DXenograft mammary tumors formed from MCFDCIS cells overexpressing miR‐105 or empty vector were collected from NSG mice for RagC IHC (n = 5 tumors for each group). The relative intensity of RagC stain in tumor stroma was quantified by ImageJ. Bar = 50 μm. In (D), data are presented as mean ± SD. *P < 0.05 (Student’s t‐test).