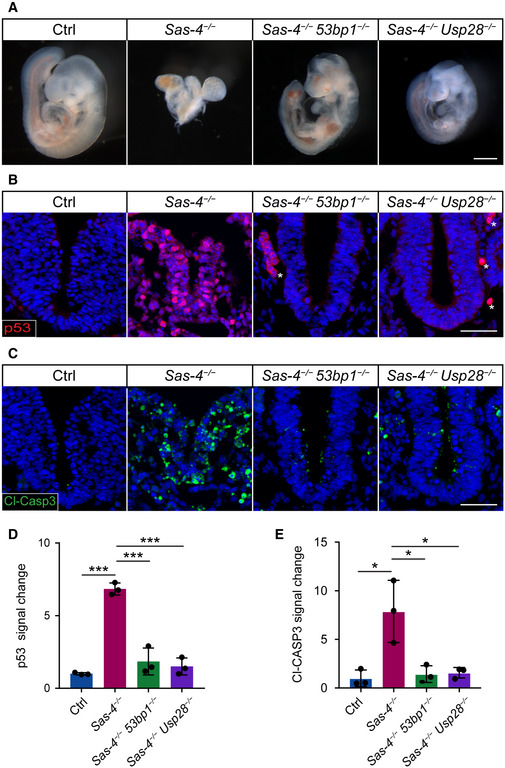
Figure 1. The mitotic surveillance pathway is conserved in the mouse in vivo .

-
AGross morphology of control (Ctrl), Sas‐4 −/−, Sas‐4 −/− 53bp1 −/−, and Sas‐4 −/− Usp28 −/− embryos at E9.5. At least five embryos were considered per genotype and all the double mutant embryos exhibited the rescue criteria mentioned in the text. Scale bar = 500 μm.
-
B, CImmunostaining for p53 (B) and Cleaved‐Caspase3 (Cl‐CASP3, (C)) on transverse sections of Ctrl, Sas‐4 −/−, Sas‐4 −/− 53bp1 −/−, and Sas‐4 −/− Usp28 −/− embryos at E9.5. The area shown encompasses the ventral neural tube and surrounding mesenchyme. Asterisks in (B) denote non‐specific staining of blood cells. Scale bar = 50 μm.
-
D, EQuantifications of the p53 (D) and Cl‐CASP3 (E) fluorescence signals shown in (B) and (C), respectively. Three embryos per genotype were used for the quantifications. ***P < 0.001, *P < 0.05 (two‐tailed Student’s t‐test, one‐way ANOVA with Tukey’s multiple comparisons tests gave similar results). Bars represent mean ± s.d. (D) Ctrl: 1.00 ± 0.06 (n = 1,770 cells); Sas‐4 −/−: 6.84 ± 0.34 (n = 275), Sas‐4 −/− 53bp1 −/−: 1.85 ± 0.75 (n = 690), Sas‐4 −/− Usp28 −/−: 1.50 ± 0.48 (n = 975). (E) Ctrl: 1.00 ± 0.70 (n = 1,690); Sas‐4 −/−: 7.88 ± 2.62 (n = 175); Sas‐4 −/− 53bp1 −/−: 1.43 ± 0.71 (n = 1030); Sas‐4 −/− Usp28 −/−: 1.57 ± 0.44 (n = 950).
