
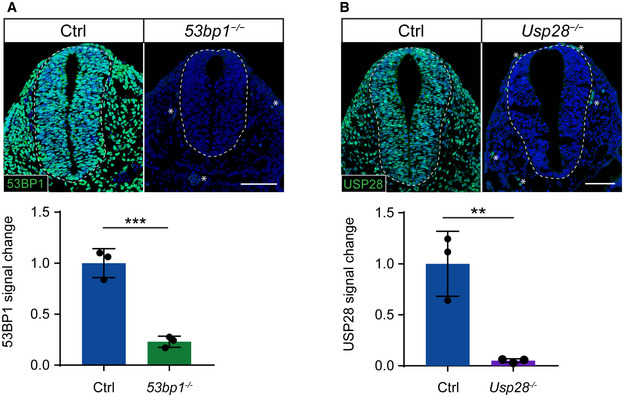
Figure EV1. 53bp1 −/− and Usp28 −/− are null alleles.
-
A, BImmunostaining and quantifications for 53BP1 (A) or USP28 (B) on sagittal sections of control (Ctrl) and Sas‐4 −/− 53bp1 −/− (A) or Usp28 −/− (B) embryos at E9.5. The signals for the corresponding proteins in the mutants compared to controls are not detectable and close to background staining of secondary antibody‐only negative controls, which were used as baseline for quantification. The cervical or brachial neural tube (the dotted quantified area) and underlying mesenchyme are shown. Asterisks indicate non‐specific staining in blood cells. Three embryos per genotype were used for the quantifications. ***P < 0.001, **P < 0.01 (two‐tailed Student’s t‐test). Bars represent mean ± s.d. Scale bars = 100 μm. (A) Ctrl: 1.00 ± 0.12; 53bp1 ‐/‐: 0.23 ± 0.04 (B) Ctrl: 1.00 ± 0.26; Usp28 ‐/‐: 0.05 ± 0.02.