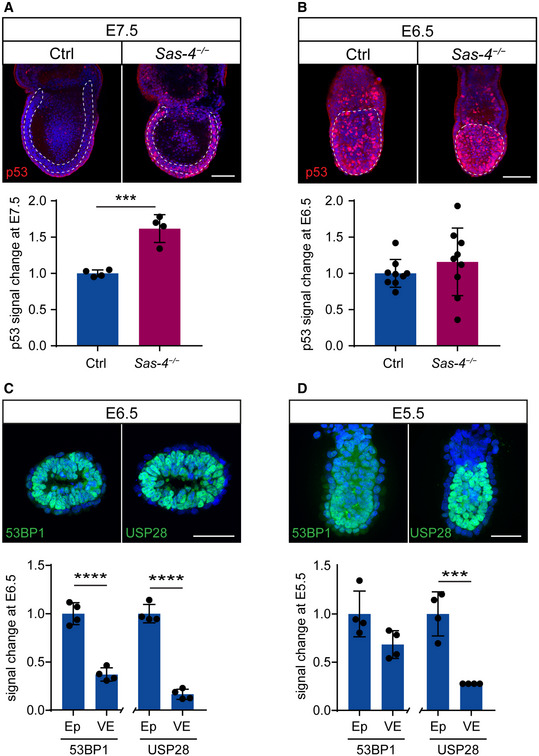
Figure 2. p53 upregulation in Sas‐4 −/− embryos is evident by E7.5 and is not due to the onset of 53BP1 or USP28 expression.

-
A, BWhole‐mount immunostaining and quantification for p53 on Ctrl and Sas‐4 −/− embryos at E7.5 (A) and E6.5 (B). Representative sagittal planes are shown and the dotted lines demarcate the epiblast. Quantification of nuclear p53 fluorescence intensity in the epiblast is shown below, normalized to control embryos in the same batch at E7.5 (4 embryos) and at E6.5 (9 embryos). ***P < 0.001 (two‐tailed Student’s t‐test). Bars represent mean ± s.d. Scale bars = 100 μm. (A) Ctrl: 1.04 ± 0.00 (n = 495 cells); Sas‐4 −/−: 1.65 ± 0.19 (n = 850). (B) Ctrl: 1.00 ± 0.18 (n = 1,665); Sas‐4 −/−: 1.16 ± 0.44 (n = 1,330).
-
C, DImmunostaining for 53BP1 and USP28 on sagittal sections of WT embryos at E6.5 (C) or sagittal planes of whole‐mount immunostaining at E5.5 (D). Quantification of the fluorescent signals in the epiblast (Ep) versus visceral endoderm (VE) are shown below. Four embryos per genotype were used for the quantifications. ****P < 0.0001, ***P < 0.001 (two‐tailed Student’s t‐test). Bars represent mean ± s.d. Scale bar = 50 μm. (C) 53BP1 in Ep: 1.00 ± 0.10 (n = 225 cells); 53BP1 in VE: 0.37 ± 0.06 (n = 105); USP28 in Ep: 1.00 ± 0.08 (n = 235); USP28 in VE: 0.17 ± 0.05 (n = 90). (D) 53BP1 in Ep: 1.00 ± 0.24 (n = 225); 53BP1 in VE: 0.68 ± 0.14 (n = 115); USP28 in Ep: 1.00 ± 0.23 (n = 280); USP28 in VE: 0.28 ± 0.00 (n = 110).
