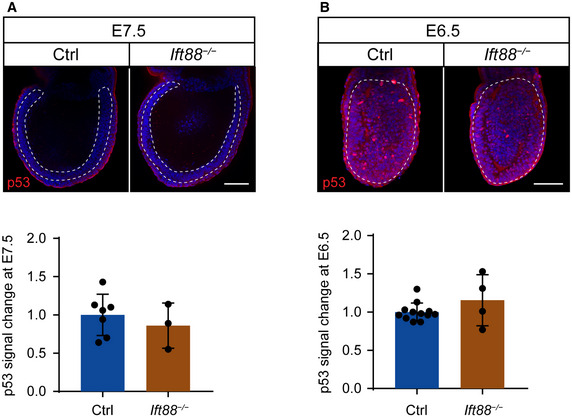
Figure EV2. Ift88 −/− cilia mutants do not upregulate p53.

-
A, BImmunostaining and quantification for p53 on whole‐mount Ctrl and Ift88 −/− embryos at E7.5 (A) and E6.5 (B). Mid‐sagittal planes are shown with the dotted lines demarcating the epiblast. Scale bars = 100 μm. The quantification of p53 nuclear fluorescence intensity in the epiblast was normalized to Ctrl embryos in the same batch at E7.5 (A) and E6.5 (B). Bars represent mean ± s.d. (two‐tailed Student’s t‐test). (A) Ctrl: 1.00 ± 0.25 (n = 11,695 cells from 8 embryos); Ift88 −/− : 0.86 ± 0.24 (n = 40,815 from 3 embryos) (B) Ctrl: 1.00 ± 0.11 (n = 8,895 from 14 embryos); Ift88 −/− : 1.16 ± 0.29 (n = 3,470 from 4 embryos).
