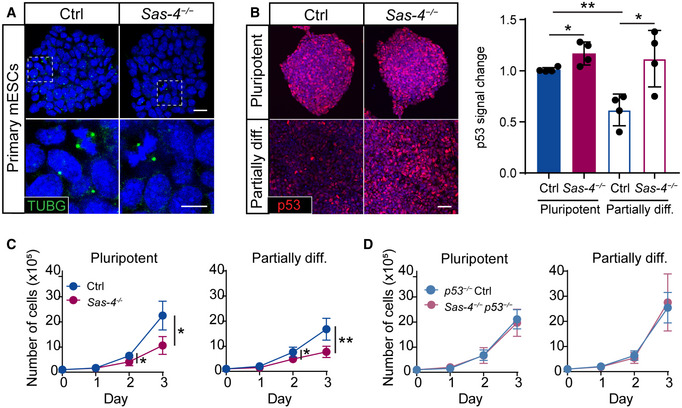
Figure 3. Sas‐4 −/− mESCs activate the mitotic surveillance pathway.

-
AImmunostaining for the centrosome marker γ‐tubulin (TUBG) on Ctrl and Sas‐4 −/− primary mESCs. The bottom panels are magnifications of the areas marked in the top panels. Scale bars = 20 μm (top) and 10 μm (bottom).
-
BImmunostaining and quantification for p53 on Ctrl and Sas‐4 −/− primary mESCs in pluripotent and partially differentiated (diff.) conditions. The quantification of p53 fluorescence intensities was normalized to Ctrl (Four independent experiments). **P < 0.01, *P < 0.05 (two‐tailed Student’s t‐test, the comparison of the genotypes in the “Pluripotent” condition was not significant using the one‐way ANOVA with Tukey’s multiple comparisons tests). Bars represent mean ± s.d. Scale bar = 50 μm. Pluripotent Ctrl: 1.00 ± 0.02 (n = 2,030 cells); pluripotent Sas‐4 −/−: 1.17 ± 0.10 (n = 2,170); partially diff. Ctrl: 0.62 ± 0.13 (n = 2,745); partially diff. Sas‐4 −/−: 1.12 ± 0.24 (n = 2,000).
-
C, DThree‐day growth curves of WT and Sas‐4 −/− (C) or p53 −/− and Sas‐4 −/− p53 −/− (D) primary mESCs in the indicated conditions starting with 105 cells on Day 0 (Four independent experiments). **P < 0.01, *P < 0.05 (two‐tailed Student’s t‐test). Bars represent mean ± s.d. For details of the measurements, see Materials and Methods (Tables 3 and 4).
