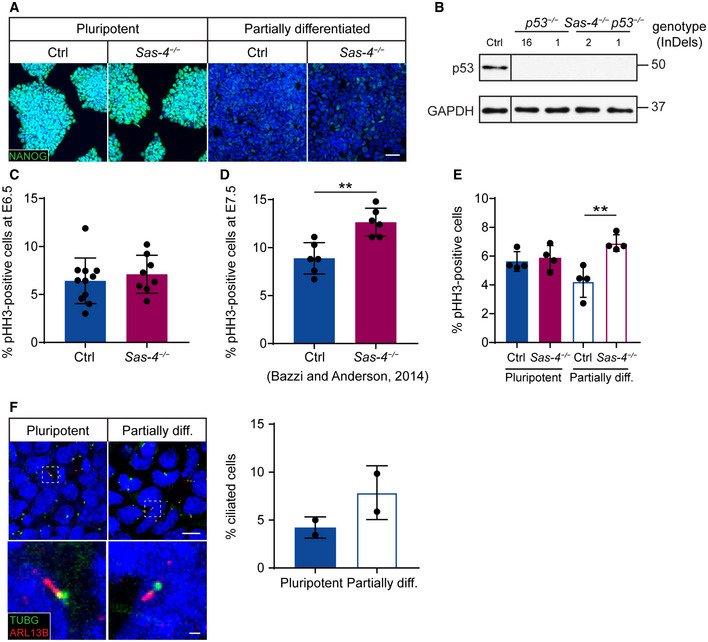
The mitotic index, or percentage of pHH3‐positive cells, of Ctrl and
Sas‐4
−/− embryo epiblast at E6.5 (
n = 8, (C)) and E7.5 (
n = 6, (D)) or mESCs (Four independent experiments) in pluripotent or partially differentiated (diff.) conditions (E). The graph in (D) represents our previously published data (Bazzi & Anderson,
2014). (F) Immunostaining and quantification of the cilia marker ARL13B, together with the basal body marker TUBG, in Ctrl mESCs in pluripotent and partially diff. conditions (Two independent experiments). The selected areas in the top panels are magnified in the bottom panels. Scale bars = 10 µm (top) and 1 µm (bottom). **
P < 0.01 (two‐tailed Student’s
t‐test or one‐way ANOVA with Tukey’s multiple comparisons tests for (E)). Bars represent mean ± s.d. (C) Ctrl: 6 ± 2 (
n = 9,545 cells);
Sas‐4
−/−: 7 ± 2 (
n = 5,875). (D) Ctrl: 9 ± 2 (
n = 5,150),
Sas‐4
−/−: 13 ± 1 (
n = 4,990); (E) Ctrl pluripotent: 6 ± 1 (
n = 2,445),
Sas‐4
−/− pluripotent: 6 ± 1 (
n = 2,330); Ctrl partially diff.: 4 ± 1 (
n = 3,015);
Sas‐4
−/− partially diff.: 7 ± 0 (
n = 2,280). (F) Pluripotent mESCs: 4 ± 1 (
n = 1,553) Partially diff. mESCs: 8 ± 2 (
n = 1,538).

