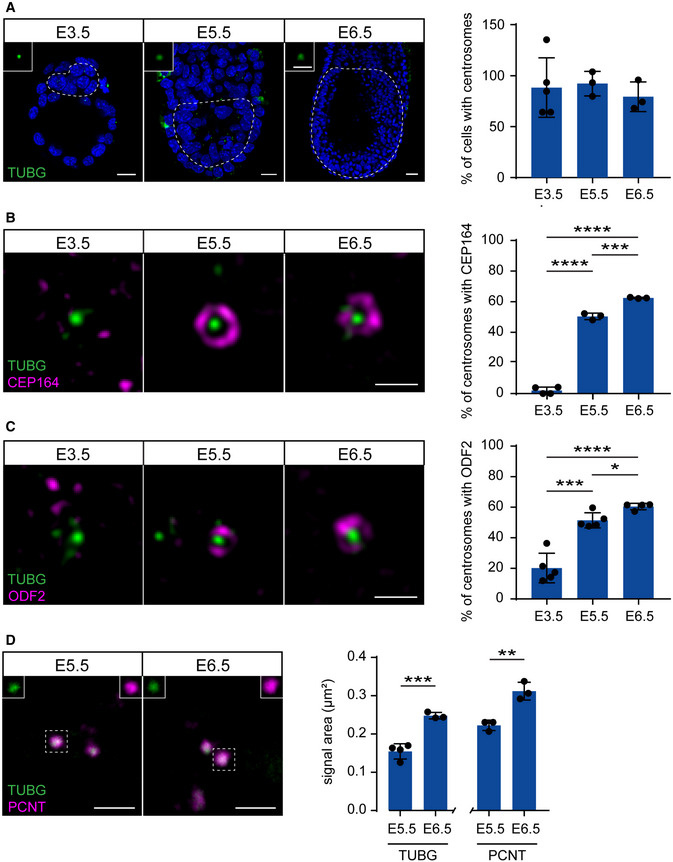
Figure 4. Centrioles gradually mature during mouse development.

-
ASagittal planes of whole‐mount immunostaining and quantification for TUBG on WT mouse embryos from E3.5 to E6.5. The insets are magnifications of selected centrosomes from the dotted areas denoting the inner cell mass (E3.5) or epiblast (E5.5 and E6.5). Bars represent mean ± s.d (two‐tailed Student’s t‐test or one‐way ANOVA with Tukey’s multiple comparisons tests). Scale bars: E3.5 and E5.5 = 15 μm; E6.5 = 30 μm and 3 μm (insets). E3.5: 88 ± 26% (n = 73 cells from 5 embryos); E5.5: 92 ± 10% (n = 270 from 3 embryos); E6.5: 79 ± 12% (n = 12,082 from 3 embryos).
-
B, CRepresentative gSTED super‐resolution images of immunostaining for TUBG and either CEP164 (B) or ODF2 (C). Whole‐mount staining was used for the CEP164 data as well as for the E3.5 blastocysts for ODF2, whereas staining on sections was used for ODF2 at E5.5 and E6.5. Quantification of the percentage of centrosomes (TUBG) with CEP164 or ODF2 are shown on the right. ****P < 0.0001, ***P < 0.001, *P < 0.05 (two‐tailed Student’s t‐test or one‐way ANOVA with Tukey’s multiple comparisons tests; the ODF2 data between E5.5 and E6.5 was not significant using the latter test). Bars represent mean ± s.d. Scale bar = 0.5 μm. CEP164 at E3.5: 2 ± 2%, (n = 92 centrosomes from 4 embryos); E5.5: 50 ± 2% (n = 249 from 3 embryos); E6.5: 62 ± 0% (n = 856 from 3 embryos). ODF2 at E3.5: 20 ± 9% (n = 108 from 5 embryos); E5.5: 51 ± 4% (n = 294 from 5 embryos); E6.5: 60 ± 2% (n = 1,183 from 4 embryos).
-
DImmunostaining and quantification of the area of TUBG and PCNT signals from E5.5 and E6.5 centrosomes in epiblast cells. The separate channels for the marked centriole are shown in the insets. ***P < 0.001, **P < 0.01 (two‐tailed Student’s t‐test). Bars represent mean ± s.d. Scale bar = 2 μm. Quantification of PCNT at E5.5: 0.22 ± 0.01 μm (n = 103 centrosomes from 3 embryos); E6.5: 0.31 ± 0.02 μm (n = 342 from 3 embryos). Quantification of TUBG at E5.5: 0.15 ± 0.02 μm (n = 108 from 4 embryos); E6.5: 0.25 ± 0.01 μm (n = 311 from 3 embryos).
