-
A
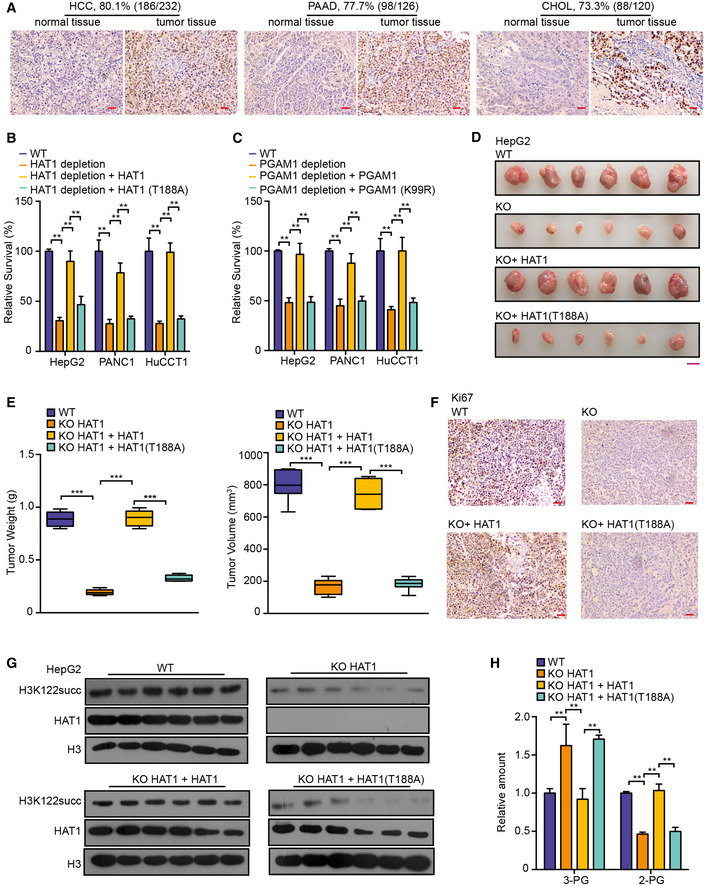
HAT1 levels were assessed by immunohistochemical staining in clinical tissues of liver cancer patients, pancreatic cancer patients, and cholangiocarcinoma patients. Scale bar = 100 μm
-
B
The effect of HAT1‐mediated succinylation on cancer cell proliferation was measured by MTS assays in the indicated cells. N = 3 biological replicates. Data are presented as mean ± SD. Student's t‐test, **P < 0.01.
-
C
The effect of PGAM1 succinylation on cancer cell proliferation was measured by MTS assays in the indicated cells. N = 3 biological replicates. Data are presented as mean ± SD. Student's t‐test, **P < 0.01.
-
D–H
HepG2 cells, HAT1 KO HepG2 cells, and HAT1 KO HepG2 cells reconstituted with either wild‐type HAT1 or mutant HAT1 (T188A) were subcutaneously injected into athymic nude mice (N = 6). (D, E) Photographs showing the tumors from the nude mice. Tumor volumes and average tumor weight were calculated. N = 6 biological replicates. Scale bar = 10 mm. In the boxplots, boxes extend from the 25th to 75th percentiles (inter‐quartile range (IQR)), central band represents the median, and whiskers indicate the lowest and highest data within 1.5 × IQR from the lower and upper quartiles, respectively. Student's t‐test, ***P < 0.001. (F) Immunohistochemical analysis of the indicated tumor sections was performed with an anti‐Ki67 antibody. The images represent the results of six tissue slides. Scale bar = 100 μm. (G) Western blot analysis was performed with the indicated antibodies. Representative images of triplicate experiments are shown. (H) The relative amounts of 3‐PG and 2‐PG were determined by ELISA assays in the tumor tissues. N = 6 biological replicates. Data are presented as mean ± SD. Student's t‐test, **P < 0.01.

