
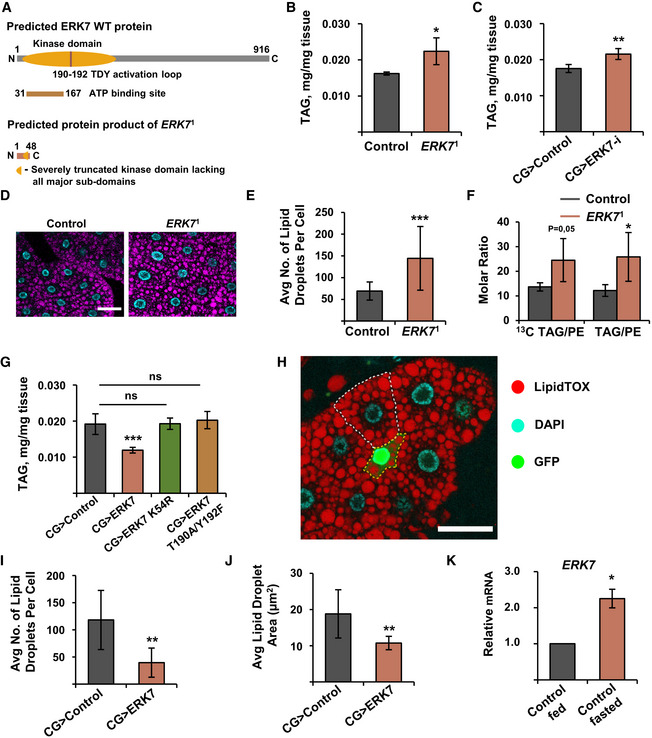
Figure 1. ERK7 inhibits lipid storage in the fat body.
-
ASchematic presentation showing the generation of ERK7 1 mutants by CRISPR/Cas9 targeting.
-
BERK7 1 mutants have elevated triacylglycerol (TAG) levels (N = 4 replicates of ≥ 10 larvae/ replicate for each genotype).
-
CFat body‐specific depletion of ERK7 by RNAi (BDSC 56939) leads to increased TAG levels (N = 4 replicates of 10 larvae/replicate for each genotype).
-
DRepresentative immunofluorescent images of lipid droplet (LipidTOX) and nuclear (DAPI) staining in control and ERK7 1 mutant fat bodies of third instar larvae. Scale bar: 50 µm.
-
EERK7 1 mutant fat body cells contain more lipid droplets than control cells (N = 30 cells for each genotype).
-
FAfter fed [13C]glucose, the ERK7 1 mutant fat bodies display elevated [13C]TAG/PE and unlabeled TAG/PE molar ratios (measured by mass spectrometry‐based lipidomics, N = 3 replicates of 15 fat bodies/replicate, TAG = triacylglycerol, PE = phosphatidylethanolamine)
-
GERK7 overexpression in the fat body results in reduced TAG levels, while kinase‐dead (K54R) and activation loop phosphorylation‐deficient (T190A/Y192F) mutants of ERK7 do not influence the TAG storage (N = 4 replicates of ≥ 10 larvae/replicate for each genotype).
-
H–JERK7 expressing, GFP‐marked, fat body clone (H, marked by yellow dotted line; scale bar: 50 µm) contains less (I) and smaller (J) lipid droplets than control cells (marked by white dotted line), visualized by LipidTOX staining (N = 11 for control and 4 for ERK7 overexpression).
-
KqRT–PCR‐based expression analysis of ERK7 from fat bodies of w 1118 larvae upon 6 h starvation. Expression of RP49 was used for normalization (N = 3 replicates of 10 fat bodies/replicate for each genotype).
Data information: N stands for the number of biological replicates. Error bars display standard deviation (SD). ns: not significant, *P < 0.05, **P < 0.01, ***P < 0.001 (Student’s t‐test).