
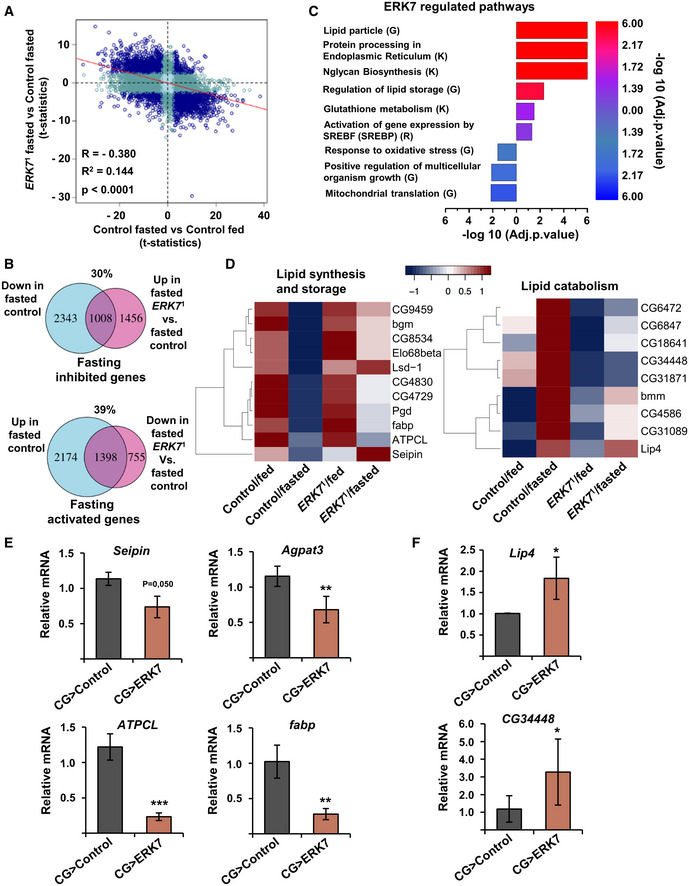
Figure 3. ERK7 regulates lipid metabolism gene expression.
-
AFour‐way plot (t‐statistics) presenting the ERK7‐dependent fasting‐responsive genes (adj.P.val < 0.05). Dark blue indicates significant in both comparisons; dark turquoise, significant in one comparison; light turquoise, not significant.
-
BVenn diagrams of the fasting‐downregulated/ERK7‐dependent transcriptome (adj.P.val < 0.05) and fasting upregulated/ERK7‐dependent transcriptome (adj.P.val < 0.05).
-
CBar plots of selected ERK7‐regulated pathways with overrepresentation of significantly changing genes (adj.P.val < 0.05, LFC < −0.5 or LFC > 0.5). The bar plot shows enrichment (−log 10 adj.P.val, generated by R/Bioconductor piano package). Blue color denotes downregulated in mutants and red denotes upregulated in mutants. G—Gene Ontology (GO), K—KEGG Pathway, R—Reactome Pathway Database.
-
DHeatmaps displaying expression patterns of selected genes involved in lipid anabolism and lipid catabolism. Color key displays scaled log2 gene expression.
-
E, FExpression analysis of Seipin, Agpat3, ATPCL, fabp, Lip4, and CG34448 by qRT–PCR. RP49 was used for normalization (N = 3 replicates of ≥10 larvae/replicate for each genotype).
Data information: N stands for the number of biological replicates. Error bars display standard deviation (SD). *P < 0.05, **P < 0.01, ***P < 0.001 (Student’s t‐test).