
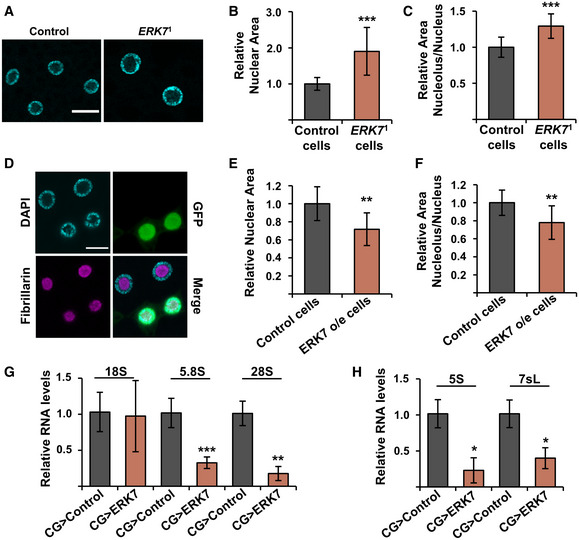
Figure 5. ERK7 regulates nucleolar size and ribosome biogenesis.
-
ARepresentative immunofluorescent images of control and ERK7 1 mutant fat bodies with DAPI staining to visualize nucleus. Scale bar: 30 µm.
-
B, CERK7 1 mutant fat bodies display increased nuclear area (B, N > 160 cells, obtained from 5 independent fat bodies) and increased nucleolar/nuclear area ratio (C, N > 80 cells for nucleolus/nucleus ratio, obtained from 5 independent fat bodies), when compared to control fat bodies.
-
D–FERK7 expressing fat body clones (D, marked by GFP, scale bar: 20 µm) display reduced nuclear area (E) and reduced nucleolar/nuclear area ratio (F), when compared to control cells. Nuclei were visualized by DAPI staining, nucleoli were visualized by anti‐fibrillarin antibodies (N = 10).
-
G, HExpression analysis of Pol I (G) and Pol III (H) target RNAs by qRT–PCR. Expression of CDK7 was used for normalization (N = 3 replicates of 10 fat bodies/replicate for each genotype).
Data information: N stands for the number of biological replicates. Error bars display standard deviation (SD). *P < 0.05, **P < 0.01, ***P < 0.001, ns—not significant (Student’s t‐test).