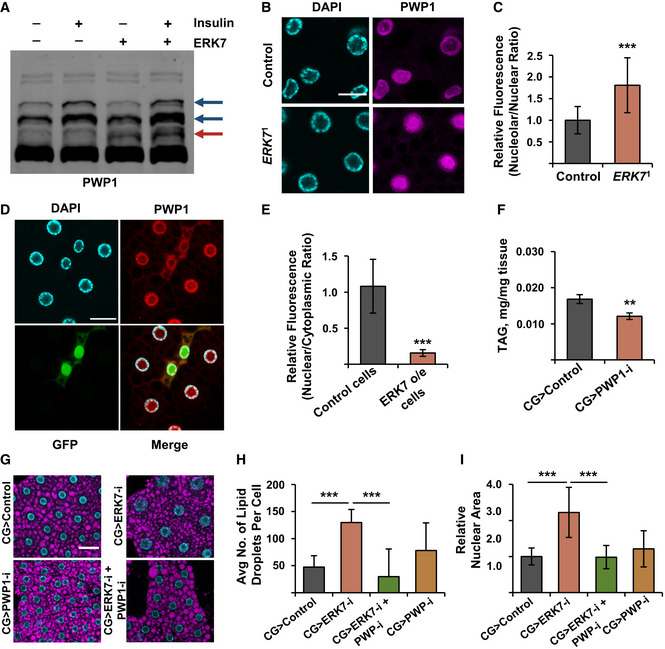
Figure 6. PWP1 acts downstream of ERK7 to control growth and lipid storage.

-
AERK7 overexpression leads to phosphorylation of PWP1, as shown by appearance of an extra band on Phos‐tag Western blot (marked with red arrow). Insulin‐inducible bands (dark blue arrows) remain unresponsive to ERK7.
-
BRepresentative immunofluorescent images of PWP1 localization in fat bodies of ERK7 1 mutant and control third instar larvae. Scale bar: 20 µm.
-
CPWP1 localization displays increased nucleolar/nuclear ratio in ERK71 mutant fat bodies compared to control (N = 20 cells from 5 independent fat bodies per genotype).
-
DRepresentative immunofluorescent images of PWP1 localization in fat bodies of third instar larvae. ERK7 overexpression (GFP‐marked clones) alters the subcellular localization of PWP1. Scale bar: 30 µm.
-
EPWP1 localization displays reduced nuclear/cytoplasmic ratio in ERK7 overexpressing clones, compared to control cells (N = 10 cells from at least 8 different fat bodies per genotype).
-
FFat body‐specific depletion of PWP1 by RNAi (NIG‐Fly 6751R‐3) leads to decreased TAG levels (N = 4 replicates of ≥ 10 larvae/replicate for each genotype).
-
GRepresentative immunofluorescent images of fat bodies in a genetic epistasis experiment using ERK7 and PWP1 fat body (CG‐GAL4) knockdown with LipidTOX staining and DAPI to visualize lipid droplets and nucleus, respectively. Scale bar: 50 µm.
-
H, IFat body‐specific knockdown of PWP1 (NIG‐Fly 6751R‐1) suppresses increased lipid droplet number (H; N > 30 cells per genotype) and increased nuclear area (I; N > 45 cells per genotype) caused by ERK7 knockdown (BDSC 56939).
Data information: N stands for the number of biological replicates. Error bars display standard deviation (SD). **P < 0.01, ***P < 0.001 (Student’s t‐test).
