
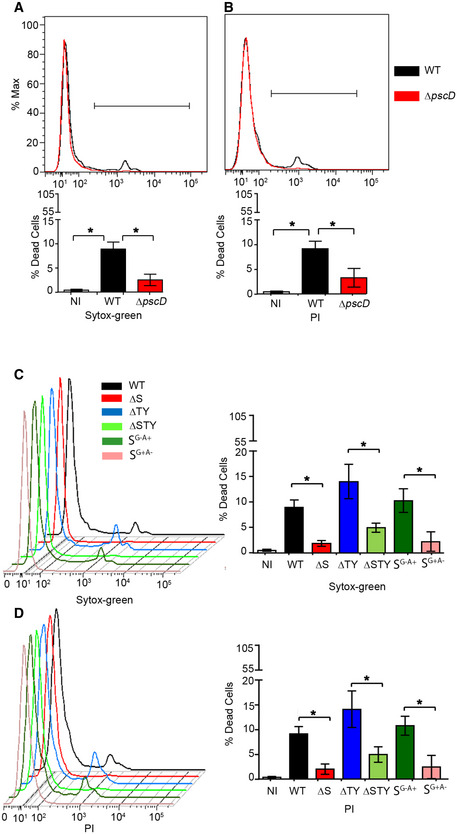
Figure EV1. Evaluation of cell death after P. aeruginosa infection.
-
A–DA549 cells were either left uninfected (NI) or infected for 4 h with WT and different P. aeruginosa mutants. Cells were then stained with Sytox‐green (A, C) or propidium iodide (PI) (B, D) and the percentage of dead cells was analyzed by flow cytometry. Data are mean +/− SD from three independent experiments; one‐way ANOVA analysis followed Dunn's multiple‐comparison posttest t, *P ≤ 0.05.