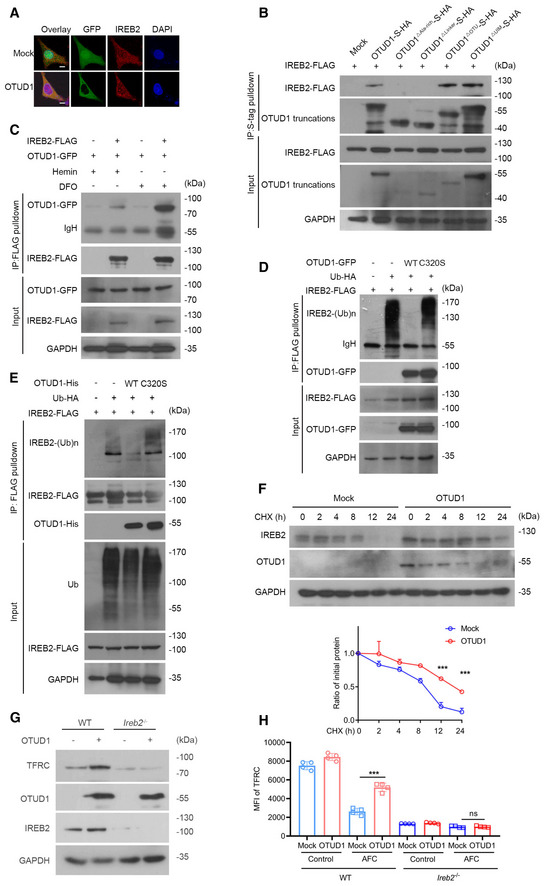
Figure EV2. OTUD1 deubiquitinases and stabilizes IREB2.

- Confocal examination of OTUD1 and IREB2 colocalization in HEK293T cells ectopically expressing GFP‐tagged OTUD1. The scale bars represent 10 μm.
- HEK293T cells were co‐transfected with IREB2‐FLAG and S‐tagged OTUD1 and its truncations. At 24 h later, cell lysates were immunoprecipitated with S‐protein agarose and analyzed by immunoblot with anti‐FLAG antibody.
- Co‐immunoprecipitation analysis of IREB2‐FLAG together with OTUD1‐GFP with treatment of hemin (100 μM) or DFO (100 μM).
- In vivo ubiquitination assay of IREB2. HEK293T cells were co‐transfected with indicated plasmids and subjected to immunoprecipitation with anti‐FLAG antibody followed by Western blot analysis.
- In vitro ubiquitination assay of IREB2. IREB2 was enriched by anti‐FLAG beads and incubated with purified OTUD1 and OTUD1C320S protein in deubiquitination buffer followed by Western blot analysis.
- Half‐life analysis of IREB2 in the presence or absence of OTUD1 in CT26 cells. Cells were treated with CHX for indicated times and analyzed by Western blot (up), and the relative protein level of IREB2 was assessed by ImageJ software (down) (n = 3 biological replicates, mean ± s.e.m., ***P < 0.001, two‐tailed unpaired Student’s t‐test).
- Analysis of endogenous IREB2 and TFRC level in wild‐type (WT) or Ireb2 −/− CT26 cells with or without OTUD1 overexpressing.
- Flow cytometric analysis of TFRC expression in wild‐type (WT) or Ireb2 −/− CT26 cells with or without OTUD1 overexpression treated with AFC (50 μM). MFI, mean fluorescence intensity. (n = 4 biological replicates, mean ± s.e.m., ns, not significant (P > 0.05), ***P = 0.0001, two‐tailed unpaired Student’s t‐test).
Source data are available online for this figure.
