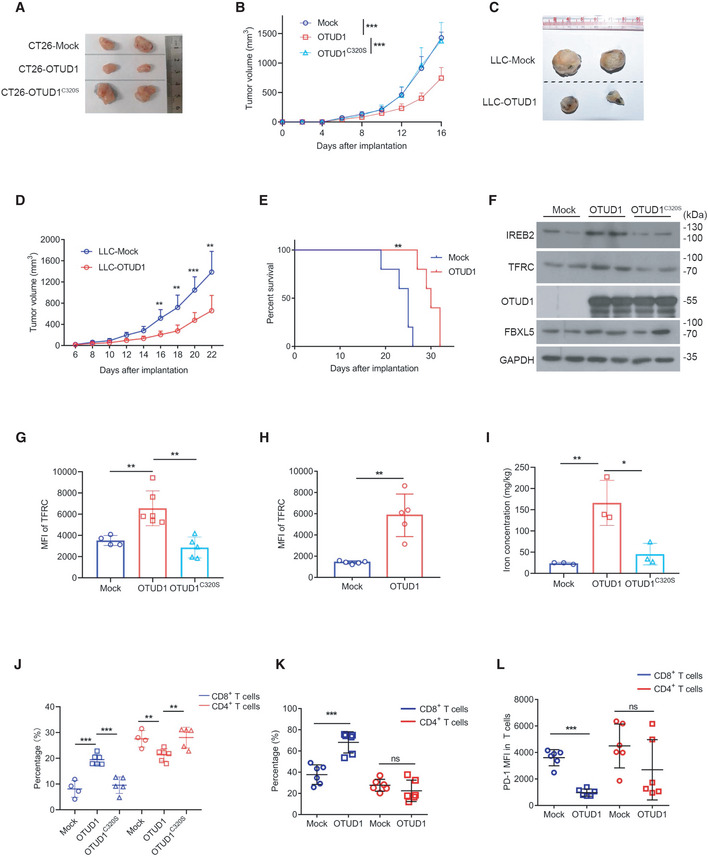
Figure 4. OTUD1 limits tumor growth and augments host antitumor immunity.

-
A, BMacroscopic evaluation (A) and tumor volume (mock, n = 7 biological replicates; OTUD1, n = 9 biological replicates; OTUD1C320S, n = 9 biological replicates; mean ± s.e.m., ***P < 0.001, two‐tailed unpaired Student’s t‐test) (B) of mock‐, OTUD1‐, and OTUD1C320S‐expressing CT26 tumors in BALB/c mice.
-
C–EMacroscopic evaluation (C), tumor volume (n = 6 biological replicates, mean ± s.e.m., **P < 0.01, ***P = 0.0007, two‐tailed unpaired Student’s t‐test) (D) and survival analysis (n = 5 biological replicates, **P = 0.0021, log‐rank (Mantel–Cox) test) (E) of mock‐ and OTUD1‐expressing LLC tumors in C57BL/6 mice.
-
FEndogenous IREB2 and TFRC protein levels in murine CT26 tumors were measured by anti‐IREB2 antibody and anti‐TFRC antibody.
-
GFlow cytometric analysis of TFRC expression in mock (n = 4 biological replicates)‐, OTUD1 (n = 6 biological replicates)‐, and OTUD1C320S (n = 5 biological replicates)‐expressing CT26 tumors. MFI, mean fluorescence intensity (mean ± s.e.m., **P < 0.01, two‐tailed unpaired Student’s t‐test).
-
HFlow cytometric analysis of TFRC expression in mock‐ or OTUD1‐expressing LLC tumors. MFI, mean fluorescence intensity (n = 5 biological replicates, mean ± s.e.m., **P = 0.0011, two‐tailed unpaired Student’s t‐test).
-
IIron concentration of mock, OTUD1, and OTUD1C320S tumors was assessed by inductively coupled plasma mass spectrometry (n = 3 biological replicates, mean ± s.e.m., *P = 0.0237, **P = 0.0098, two‐tailed unpaired Student’s t‐test).
-
JAnalysis of tumor‐infiltrating CD8+ T cells or CD4+ T cells in mock (n = 4 biological replicates)‐, OTUD1 (n = 6 biological replicates)‐, and OTUD1C320S (n = 5 biological replicates)‐expressing CT26 tumors in BALB/c mice (mean ± s.e.m., **P < 0.01, ***P < 0.001, two‐tailed unpaired Student’s t‐test).‡
-
K, LFlow cytometric analysis of CD8+ T cells, CD4+ T cells (n = 6 biological replicates, mean ± s.e.m., ns, not significant (P > 0.05), ***P = 0.0003, two‐tailed unpaired Student’s t‐test) (K) and PD‐1 expression in T cells (n = 6 biological replicates, mean ± s.e.m., ns, not significant (P > 0.05), ***P < 0.0001, two‐tailed unpaired Student’s t‐test) (L) isolated from mock‐ and OTUD1‐overexpressing LLC tumors. MFI, mean fluorescence intensity.
Source data are available online for this figure.
