-
A
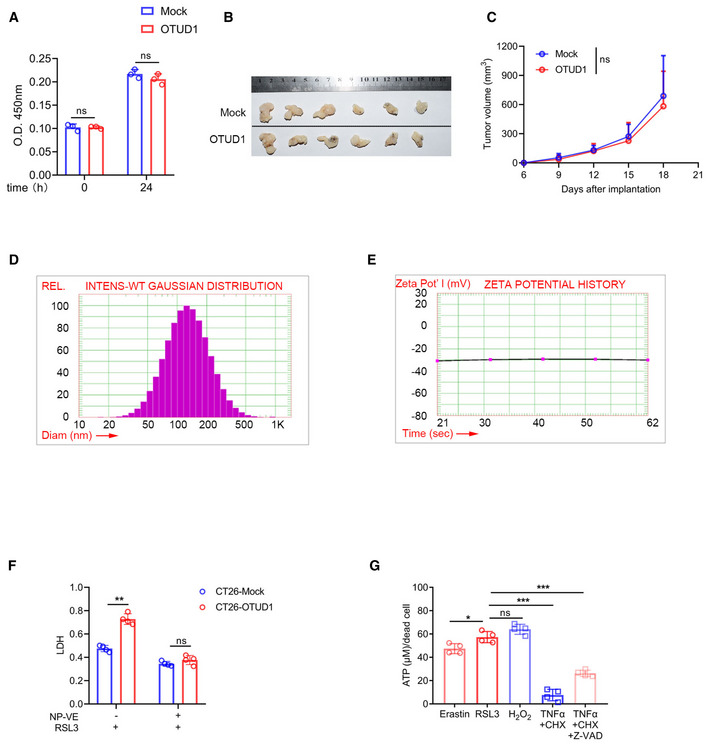
Proliferation of mock‐ or OTUD1‐expressing CT26 cells was measured by CCK‐8 (n = 3 biological replicates, mean ± s.e.m., ns, not significant (P > 0.05), two‐tailed unpaired Student’s t‐test).
-
B, C
Macroscopic evaluation (B) and tumor volume (n = 6 biological replicates, mean ± s.e.m., ns, not significant (P > 0.05), two‐tailed unpaired Student’s t‐test) (C) of mock‐ and OTUD1‐expressing CT26 tumors in NOD‐SCID mice.
-
D, E
The particle size (D) and zeta‐potential (E) of vitamin E nanoparticles (NP‐VE) were determined by PSS ZPW388‐NICOMP Particle Sizing System.
-
F
Mock‐ and OTUD1‐expressing CT26 cells treated with indicated regents (RSL3, 10 μM; NP‐VE, 20 mM) for 12 h and LDH releasing level was detected (n = 4 biological replicates, mean ± s.e.m., ns, not significant (P > 0.05), **P = 0.0029, two‐tailed unpaired Student’s t‐test).
-
G
ATP leaking in NCM460 cells treated with several cell death inducers including Erastin (10 μM), RSL3 (5 μM), TNFα (100 ng/ml), CHX (2 μg/ml), Z‐VAD (25 μM), and H2O2 (100 μM) was detected (n = 4 biological replicates, mean ± s.e.m., ns, not significant (P > 0.05), *P = 0.0214, ***P < 0.001, two‐tailed unpaired Student’s t‐test).

