-
A
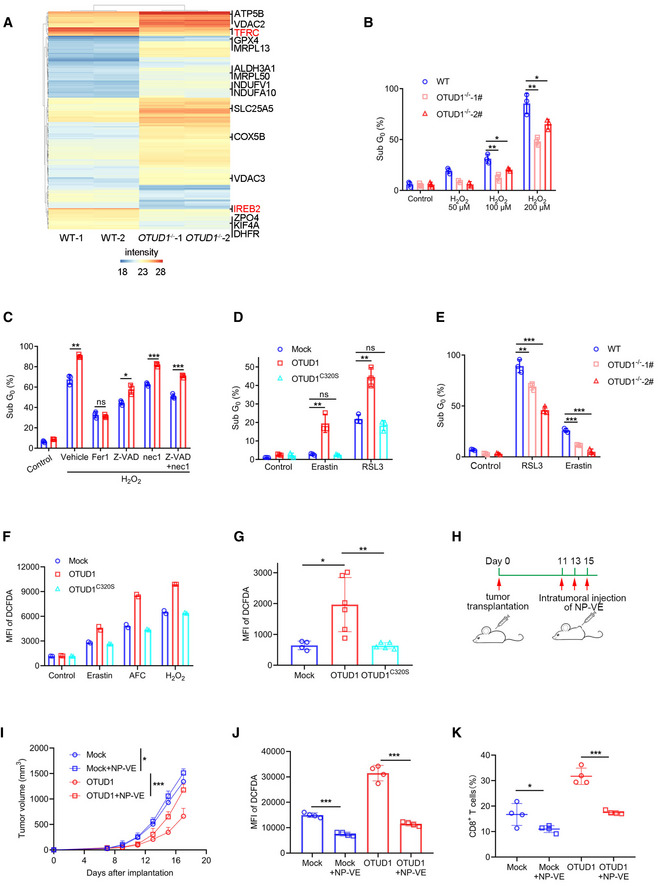
Quantitative proteomics study of wild‐type (WT) and OTUD1
−/− NCM460 cells. The expression of TFRC and IREB2 was highlighted with red color. Intensity indicates label‐free quantification (LFQ) intensity of proteins in mass spectrometry.
-
B
Wild‐type (WT) and OTUD1
−/− NCM460 cells were treated with indicated concentration of H2O2 for 24 h, and cell viability was measured by PI staining (n = 3 biological replicates, mean ± s.e.m., *P < 0.05, **P < 0.01, two‐tailed unpaired Student’s t‐test).
-
C
CT26 cells stably expressing mock or OTUD1 were treated with 200 μM H2O2 together with various cell death inhibitors containing Fer‐1 (10 μM), Z‐VAD (25 μM), and nec‐1 (20 μM). Cell viability was measured by PI staining (n = 3 biological replicates, mean ± s.e.m., ns, not significant (P > 0.05), *P = 0.0119, **P = 0.0015, ***P < 0.001, two‐tailed unpaired Student’s t‐test).
-
D
CT26 cells stably expressing mock, OTUD1, or OTUD1C320S were treated with Erastin (10 μM) and RSL3 (5 μM), and cell viability was measured by PI staining (n = 3 biological replicates, mean ± s.e.m., ns, not significant (P > 0.05), **P < 0.01, two‐tailed unpaired Student’s t‐test).
-
E
Wild‐type (WT) and OTUD1
−/− NCM460 cells were treated with Erastin (10 μM) and RSL3 (5 μM) for 24 h, and cell viability was measured by PI staining (n = 3 biological replicates, mean ± s.e.m., **P = 0.0082, ***P < 0.001, two‐tailed unpaired Student’s t‐test).
-
F
Intracellular ROS levels in mock‐, OTUD1‐, and OTUD1C320S‐overexpressing CT26 cells treated with Erastin (10 μM), AFC (50 μM), or H2O2 (100 μM) were detected by DCFDA staining. MFI, mean fluorescence intensity (n = 2 biological replicates).
-
G
Intracellular ROS levels in mock (n = 4 biological replicates)‐, OTUD1 (n = 6 biological replicates)‐, or OTUD1C320S (n = 5 biological replicates)‐expressing CT26 tumors (mean ± s.e.m., *P = 0.0189, **P = 0.0086, two‐tailed unpaired Student’s t‐test) were detected by DCFDA staining. MFI, mean fluorescence intensity.
-
H
Schematic diagram of subcutaneous tumor treatment with nanoparticle‐loading vitamin E (NP‐VE). BALB/c mice were transplanted with 1 × 10⁶ mock‐ or OTUD1‐expressing CT26 cells. 50uL of 5M NP‐VE was intratumorally injected every other day as shown.
-
I
Tumor volume (mock, n = 4 biological replicates; mock + NP‐VE, n = 6 biological replicates; OTUD1, n = 4 biological replicates; OTUD1 + NP‐VE, n = 6 biological replicates; mean ± s.e.m., *P = 0.0325, ***P = 0.0003, two‐tailed unpaired Student’s t‐test)
-
J, K
Flow cytometric analysis of DCFDA (n = 4 biological replicates, mean ± s.e.m., ***P < 0.001, two‐tailed unpaired Student’s t‐test) (J) and the percentage of tumor‐infiltrating CD8+ T cells (n = 4 biological replicates, mean ± s.e.m., *P = 0.0433, ***P = 0.0001, two‐tailed unpaired Student’s t‐test) (K) of mock‐ or OTUD1‐expressing CT26 tumors treated with or without NP‐VE. MFI, mean fluorescence intensity.

