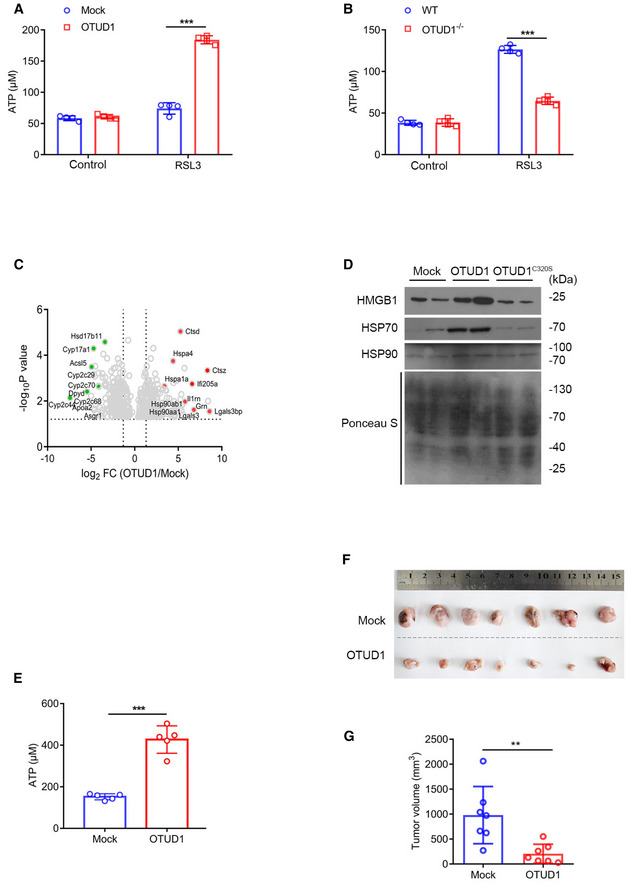
Figure 6. OTUD1 triggers immunogenic cell death.

-
A, BCT26 cells stably expressing mock or OTUD1 (A) and wild‐type (WT) or OTUD1 −/− NCM460 cells (B) were treated with 5 μM RSL3, and medium was collected to measure ATP level (n = 4 biological replicates, mean ± s.e.m., ***P < 0.0001, two‐tailed unpaired Student’s t‐test).
-
CVolcano plots of genes differentially expressed in tumor interstitial fluid (TIF) of mock‐ and OTUD1‐expressing CT26 tumors. Left, example of genes downregulated in OTUD1‐overexpressing tumor interstitial fluid; right, example of genes upregulated in OTUD1‐overexpressing tumor interstitial fluid.
-
DImmunoblot analysis of protein levels of HMGB1, HSP70, and HSP90 in tumor interstitial fluid of mock‐, OTUD1‐, and OTUD1C320S‐expressing CT26 tumors.
-
EATP level in tumor interstitial fluid (TIF) of mock‐ or OTUD1‐overexpressing CT26 cells (n = 5 mice, mean ± s.e.m., ***P < 0.001, two‐tailed unpaired Student’s t‐test).
-
F, GBALB/c mice were immunized with 1 × 10⁶ OTUD1‐expressing or mock CT26 cells in the left flank and challenged with 2 × 10⁶ wild‐type CT26 cells in the right flank 10 days later. Macroscopic evaluation (F) and tumor volume (n = 7 mice, mean ± s.e.m., **P = 0.0053, two‐tailed unpaired Student’s t‐test) (G) of tumors in the right flank were shown.
Source data are available online for this figure.
