
Figure 5. REST/NRSF target genes were not enriched at E11.5 in offspring embryonic brains derived from aged fathers.
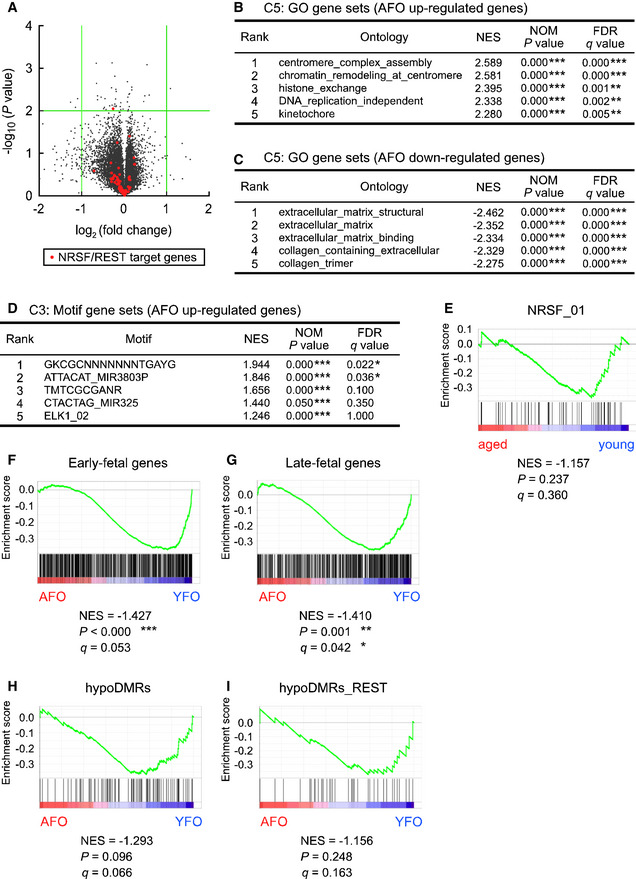
- Volcano plot for DEGs in the embryonic brain of YFO and AFO at E11.5 (n = 3 in each group). Green lines indicate a twofold change and P = 0.01. Orange dots indicate REST/NRSF target genes.
- GO gene sets in AFO upregulated genes.
- GO gene sets in AFO downregulated genes.
- Motif gene sets in AFO upregulated genes.
- GSEA plots of DEGs for REST/NRSF target gene sets.
- GSEA plots of DEGs for early‐fetal gene sets.
- GSEA plots of DEGs for late‐fetal gene sets.
- GSEA plots of DEGs for DNA hypo‐methylation neighboring gene sets.
- GSEA plots of DEGs for DNA hypo‐methylation neighboring gene sets with REST/NRSF binding motifs.
Data information: Data are presented in the volcano plot or line chart format. *P < 0.05, **P < 0.01, ***P < 0.001, determined by volcano or nominal GSEA P‐value. NES, normalized enrichment score.