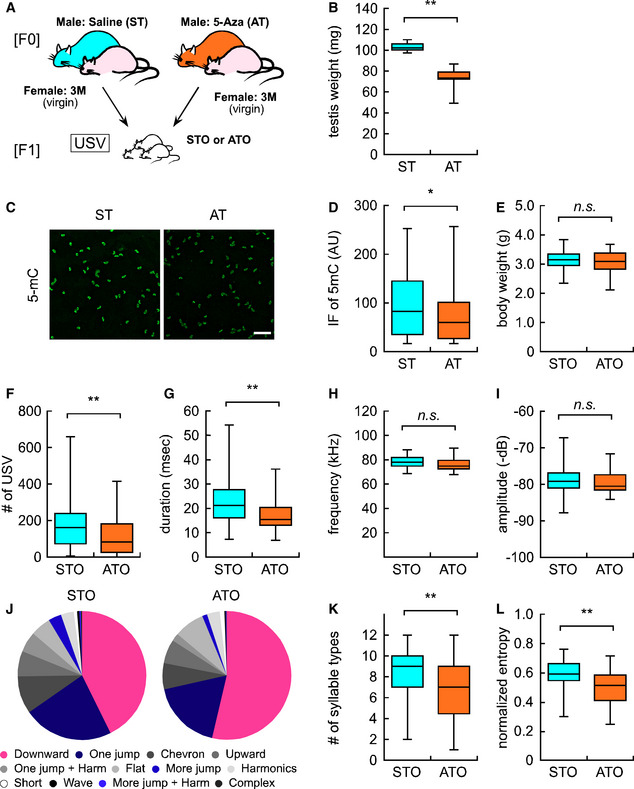
Figure 7. DNA hypo‐methylation in sperm from 5‐Aza‐treated mice caused vocal communication deficits in offspring.

- Experimental design for F1 offspring derived from either saline or 5‐Aza‐treated fathers (ST and AT, respectively).
- Testis weight in ST (n = 6, from different male mice) and AT (n = 6, from different male mice).
- Representative image of 5‐mC immunofluorescence in the sperm of saline‐ and 5‐Aza‐treated mice (ST and AT, respectively). Scale bar: 100 μm.
- Quantification analysis of 5‐mC immunofluorescence in individual sperm cells from STO (n = 1,673 sperm from 4 male mice) and ATO (n = 2,675 sperm from 4 male mice).
- Bodyweight in STO (n = 49) and ATO (n = 36).
- Overall USV number in STO and ATO.
- Average duration (msec) of each syllable in STO and ATO.
- Maximum frequency (kHz) of each syllable in STO and ATO.
- Maximum amplitude (−dB) of each syllable in STO and ATO.
- Ratio of each syllable type in STO and ATO. Each color corresponds to individual syllable categories shown in Fig 1G.
- Number of syllable types in STO and ATO.
- Normalized entropy in STO and ATO.
Data information: All data are presented in the box plot format. The central band in each box represents the median, boxes indicate the middle quartiles, whiskers extended to the minimum and maximum values. *P < 0.05 and **P < 0.01, determined using Student’s or Welch t‐test.
