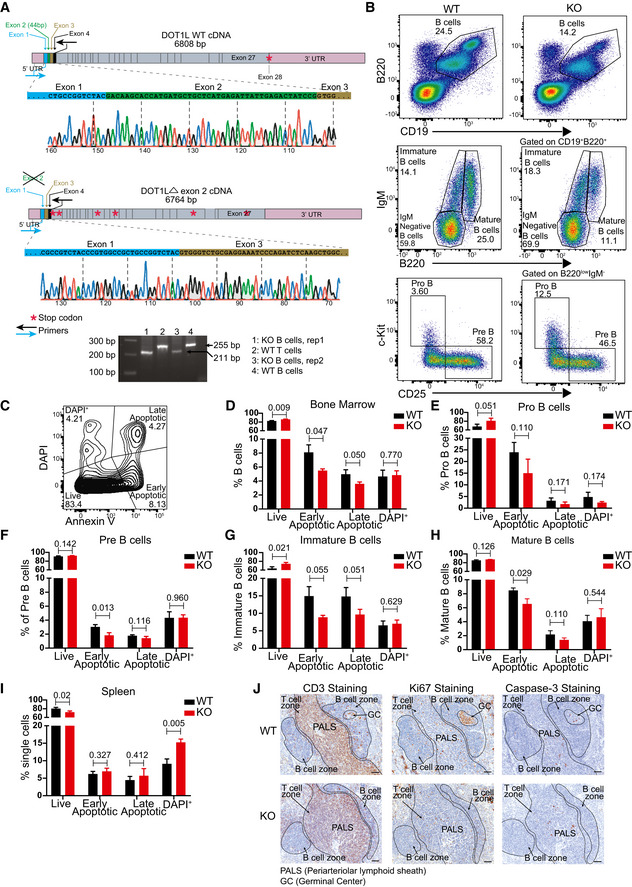
Figure EV1. Validation of the experimental system, flow cytometer gating strategy to identify and compare different bone marrow B lineage subsets and ex vivo and in situ analysis of cell viability in WT and KO mice.

-
ASchematic view of WT and KO (Δ exon 2) cDNA of Dot1L showing UTRs, exons, physiological translational stop codon for WT, multiple translational stop codons (position not to scale) generated after frameshifting induced in KO and location of primers used in RT–PCR to amplify the region flanking exon 2. Chromatograph generated by sanger sequencing showing Cre‐mediated deletion of exon 2 leading to joining of exon 1 to exon 3 in KO. Agarose gel picture showing the deletion of 44 bp corresponding to exon 2 specifically in KO‐B cells. Results represent the data from one experiment, and numbers represent biological replicates for each group (WT; n = 1, KO; n = 2).
-
BRepresentative flow cytometry plots showing gating strategy to identify and compare relative frequency of different B lineage precursor subsets in the bone marrow from WT and KO mice.
-
CRepresentative flow cytometry plots showing gating strategy to identify and compare relative frequency of live, early apoptotic, late apoptotic, and DAPI+ cells in bone marrow.
-
D–HStatistical analysis of the relative frequency of live, early apoptotic, late apoptotic, and DAPI+ cells from the total B lineage and its subsets in the bone marrow from WT and KO mice. Results represent the data from one experiment, and numbers represent biological replicates for each group (WT; n = 3, KO; n = 3).
-
IStatistical analysis of the relative frequency of live, early apoptotic, late apoptotic and DAPI+ cells from mature spleen B cells from WT and KO mice. Results represent the data from one experiment, and numbers represent biological replicates for each group (WT; n = 3, KO; n = 3).
-
JImmunohistochemistry staining for CD3, Ki67 and cleaved caspase‐3 on spleen sections from WT and KO mice. Results represent the data from at one experiment, and numbers represent biological replicates for each group (WT; n = 4, KO; n = 4).
Data information: Statistical analysis were performed using Student’s two‐tailed unpaired t‐test. Statistical significance was determined by calculating P‐value. P‐value less than 0.05 was considered as significant. Bars and error bars indicate mean ± SD.
