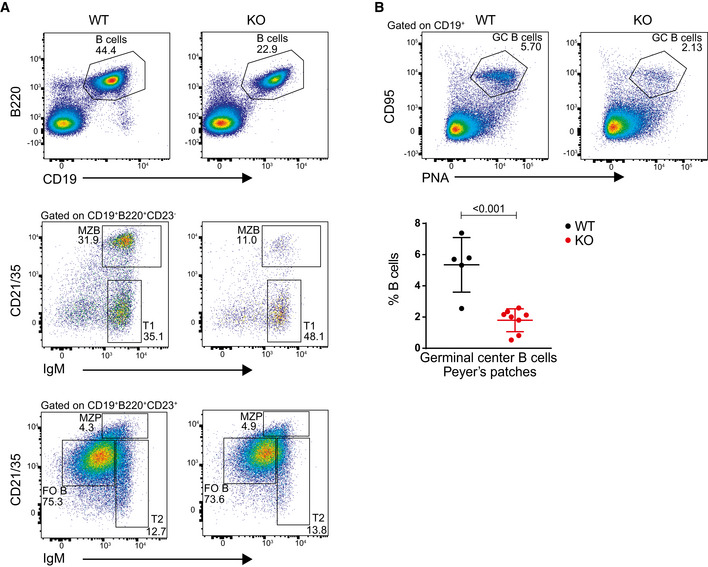
Figure EV2. Gating strategy to identify and compare the spleen B cells, different B‐cell subsets, and germinal center B cells from Peyer’s patches of WT and KO conditions.

- Representative flow cytometry plots showing gating strategy to identify and compare relative frequency of mature B cells and different B‐cell subsets from the spleen of WT and KO mice.
- Representative flow cytometry plots showing gating strategy to identify and compare germinal center B cells from Peyer’s patches from WT and KO mice (upper panel). Statistical analysis of the percentage of germinal center B cells of total B from Peyer’s patches (lower panel). Results represent the data from three independent experiments, and numbers represent biological replicates for each group (WT; n = 5, KO; n = 8).
Data information: Statistical analyses were performed using the Student’s two‐tailed unpaired t‐test. Statistical significance was determined by calculating the P‐value. P‐value less than 0.05 was considered as significant. Bars and error bars indicate mean ± SD.
