
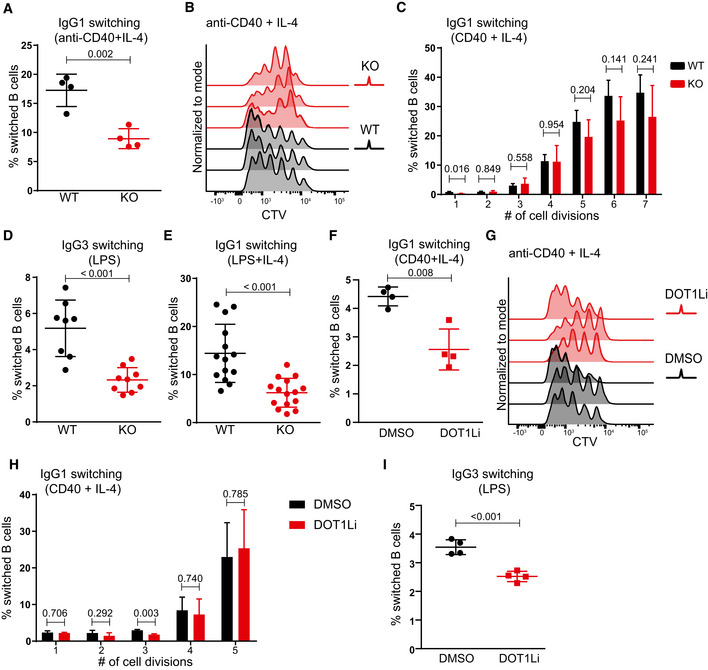
Figure 3. Class switch recombination and proliferative potential of Dot1L‐deficient B cells in response to T cell‐dependent and T cell‐independent stimuli in vitro .
-
AStatistical analysis of IgG1 switching of Dot1L‐proficient (WT) and Dot1L‐deficient (KO) B cells after 4 days of activation with anti‐CD40 + IL‐4. Results represent the data from one experiment, and numbers represent biological replicates for each group (WT; n = 4, KO; n = 4).
-
BNumber of cell divisions traced by CTV dilution of B cells stimulated for 4 days with anti‐CD40 + IL‐4. Data represent three biological replicates for each genotype.
-
CStatistical analysis of the percentage of IgG1 switched cells per generation of proliferating WT and KO B cells after 4 days of stimulation with anti‐CD40 + IL‐4. Results represent the data from one experiment, and numbers represent biological replicates for each group (WT; n = 4, KO; n = 4).
-
D, EStatistical analysis of switching of WT and KO naïve B cells activated for 4 days with LPS alone (IgG3 switching) (D) or with LPS + IL‐4 (IgG1 switching) (E). Results represent the data pooled from at least four independent experiments, and numbers represent biological replicates for each group (D: (WT) n = 8, (KO) n = 9; E: (WT) n = 11, (KO) n = 13).
-
FStatistical analysis of IgG1 switching of naïve B cells after 4 days of activation with anti‐CD40 + IL‐4 in the presence of the DOT1L inhibitor Pinometostat or DMSO as a control. Results represent the data from one experiment, and numbers represent biological replicates for each treatment (n = 4).
-
GNumber of cell divisions traced by CTV dilution of B cells stimulated for 4 days with anti‐CD40 + IL‐4 either in the presence of DOT1L inhibitor Pinometostat or DMSO as a control. Data represents three biological replicates for each treatment.
-
HStatistical analysis of the percentage of IgG1 switched cells per generation of proliferating WT B cells after 4 days of stimulation with anti‐CD40 + IL‐4 either in the presence of DOT1L inhibitor Pinometostat or DMSO as a control. Results represent the data from one experiment, and numbers represent biological replicates for each treatment (n = 3).
-
IStatistical analysis of IgG3 switching of naïve B cells after 4 days of activation with LPS alone in the presence of the DOT1L inhibitor Pinometostat or DMSO as a control. Results represent the data from one experiment, and numbers represent biological replicates for each treatment (n = 4).
Data information: Statistical analyses were performed using the Student’s two‐tailed unpaired t‐test. Statistical significance was determined by calculating the P‐value. A P‐value of less than 0.05 was considered as significant. Bars and error bars indicate mean ± SD.