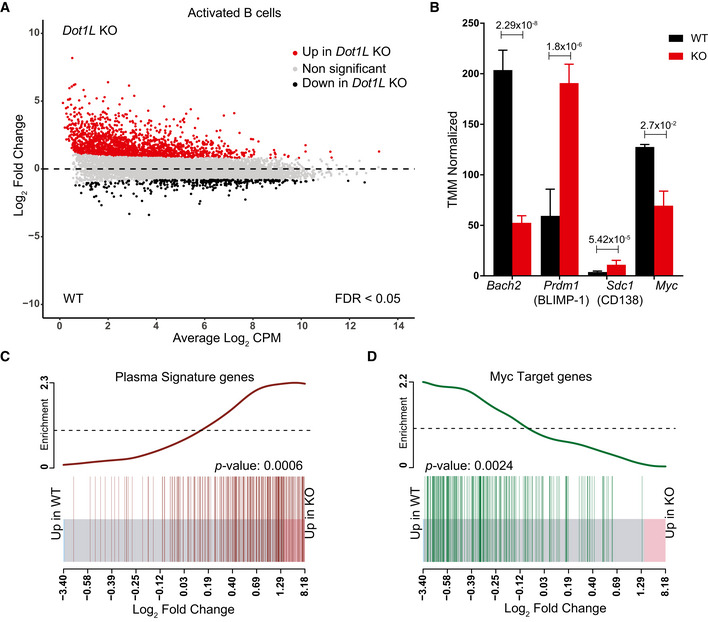
Figure 6. Transcriptome analysis of in vitro‐activated B cells shows accelerated plasma cell differentiation and compromised activation of MYC‐target genes in the absence of DOT1L.

-
AMA‐Plot of normalized RNA‐Seq data generated from three independent biological replicates for each genotype showing differential (false discovery rate (FDR) < 0.05) expression of genes between Dot1L‐KO and WT B cells after 2 days of in vitro activation with LPS + IL‐4.
-
BDifferential (FDR < 0.05) expression of Bach2, Prdm1 (encoding BLIMP‐1), Cd138 (a plasma cell marker), and Myc transcripts as indicated by counts per million after TMM normalization from WT and KO. Data were generated from three independent biological replicates for each genotype. Bars and error bars indicate mean ± SD. Statistical significance is indicated by FDR after the Benjamini–Hochberg multiple testing correction performed by edgeR package using R language.
-
C, DEnrichment of plasma cell signature genes in KO as compared to WT‐activated B cells (C) and Enrichment of MYC‐target genes in WT as compared to KO‐activated B cells (D). Enrichment of gene sets is depicted by a BARCODE plot; P‐value calculated via FRY test show the statistical significance of enrichment of each gene set. A P‐value less than 0.05 was considered as significant.
Source data are available online for this figure.
