
Figure 7. DOT1L‐mediated H3K79 methylation is associated with gene activity in B cells and indirectly promotes repression of PRC2 target genes.
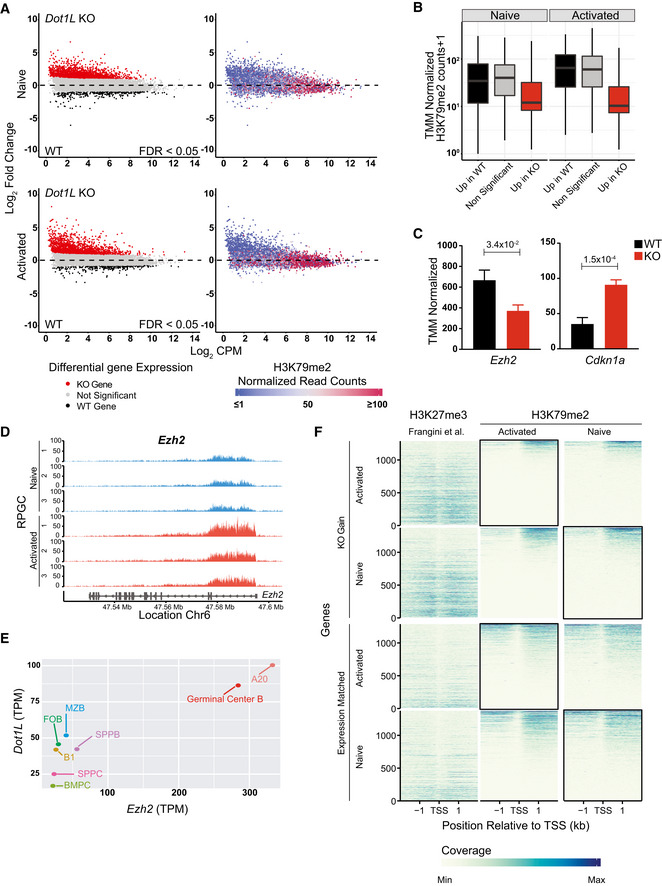
- Integrative analyses of differentially (FDR < 0.05) expressed transcripts from naïve and activated Dot1L‐deficient B cells (left panel) with H3K79me2 ChIP values from WT naïve and activated B cells (right panel).
- The distribution of mean H3K79me2 among different gene sets (6A, left panel) from activated and naïve B cells depicted by box plots. Boxes in Box plot indicate Inter quartile range (IQR) and whiskers show 1.5 IQR of highest and lowest quartile. Central horizontal line within the bars represent median of the TMM normalized H3K79me2 counts + 1 values of the respective genes for each condition. Results represent the data generated from three biological replicates for each group.
- Differential (FDR < 0.05) expression of Ezh2 and Cdkn1a as indicated by counts per million after TMM normalization from WT and Dot1L‐KO‐activated B cells. Data were generated from three independent biological replicates for each genotype. Bars and error bars indicate mean ± SD. Statistical significance is indicated by FDR after the Benjamini–Hochberg multiple testing correction performed by edgeR package using R language.
- H3K79me2 methylation at the Ezh2 locus from WT activated and naïve B cells, as determined by reads per genomic content (RPGC). Data represent three independent biological replicates.
- Correlation between expression of Ezh2 and Dot1L as depicted by TPM in different mature B‐cell subsets; B1: B1 cells, MZB: marginal Zone B, FOB: follicular B, GCB: germinal Center B, SPLPB: spleen plasma blast, SPLPC: spleen plasma cells) and Bone Marrow (BMPC: Bone marrow plasma cells) A20: Germinal Center like cell lymphoma cell line. Correlation shown by scatter plot.
- Coverage plot of H3K27me3 from naïve B cells (Frangini et al, 2013) and H3K79me2 (from WT‐activated and naïve B cells) flanking 4 kb around transcriptional start sites (TSS) for genes upregulated in KO (KO Gain) or non‐differential Expression‐matched genes. Coverage was calculated as reads per genomic content cutoff at the 0.995th quantile and rescaled to a maximum of 1. Black boxes indicate the relavant B‐cell population for comparing the distribution of H3K27me3 and H3K79me2 for the indicated gene sets obtained from the differential gene expression analysis of Dot1L‐proficient and deficient B cells.
Data information: Statistical analysis were performed using Student’s two‐tailed unpaired t‐test. Statistical significance was determined by calculating P‐value. P‐value lesser than 0.05 was considered as significant. Bars and error bars indicate mean ± SD.
Source data are available online for this figure.