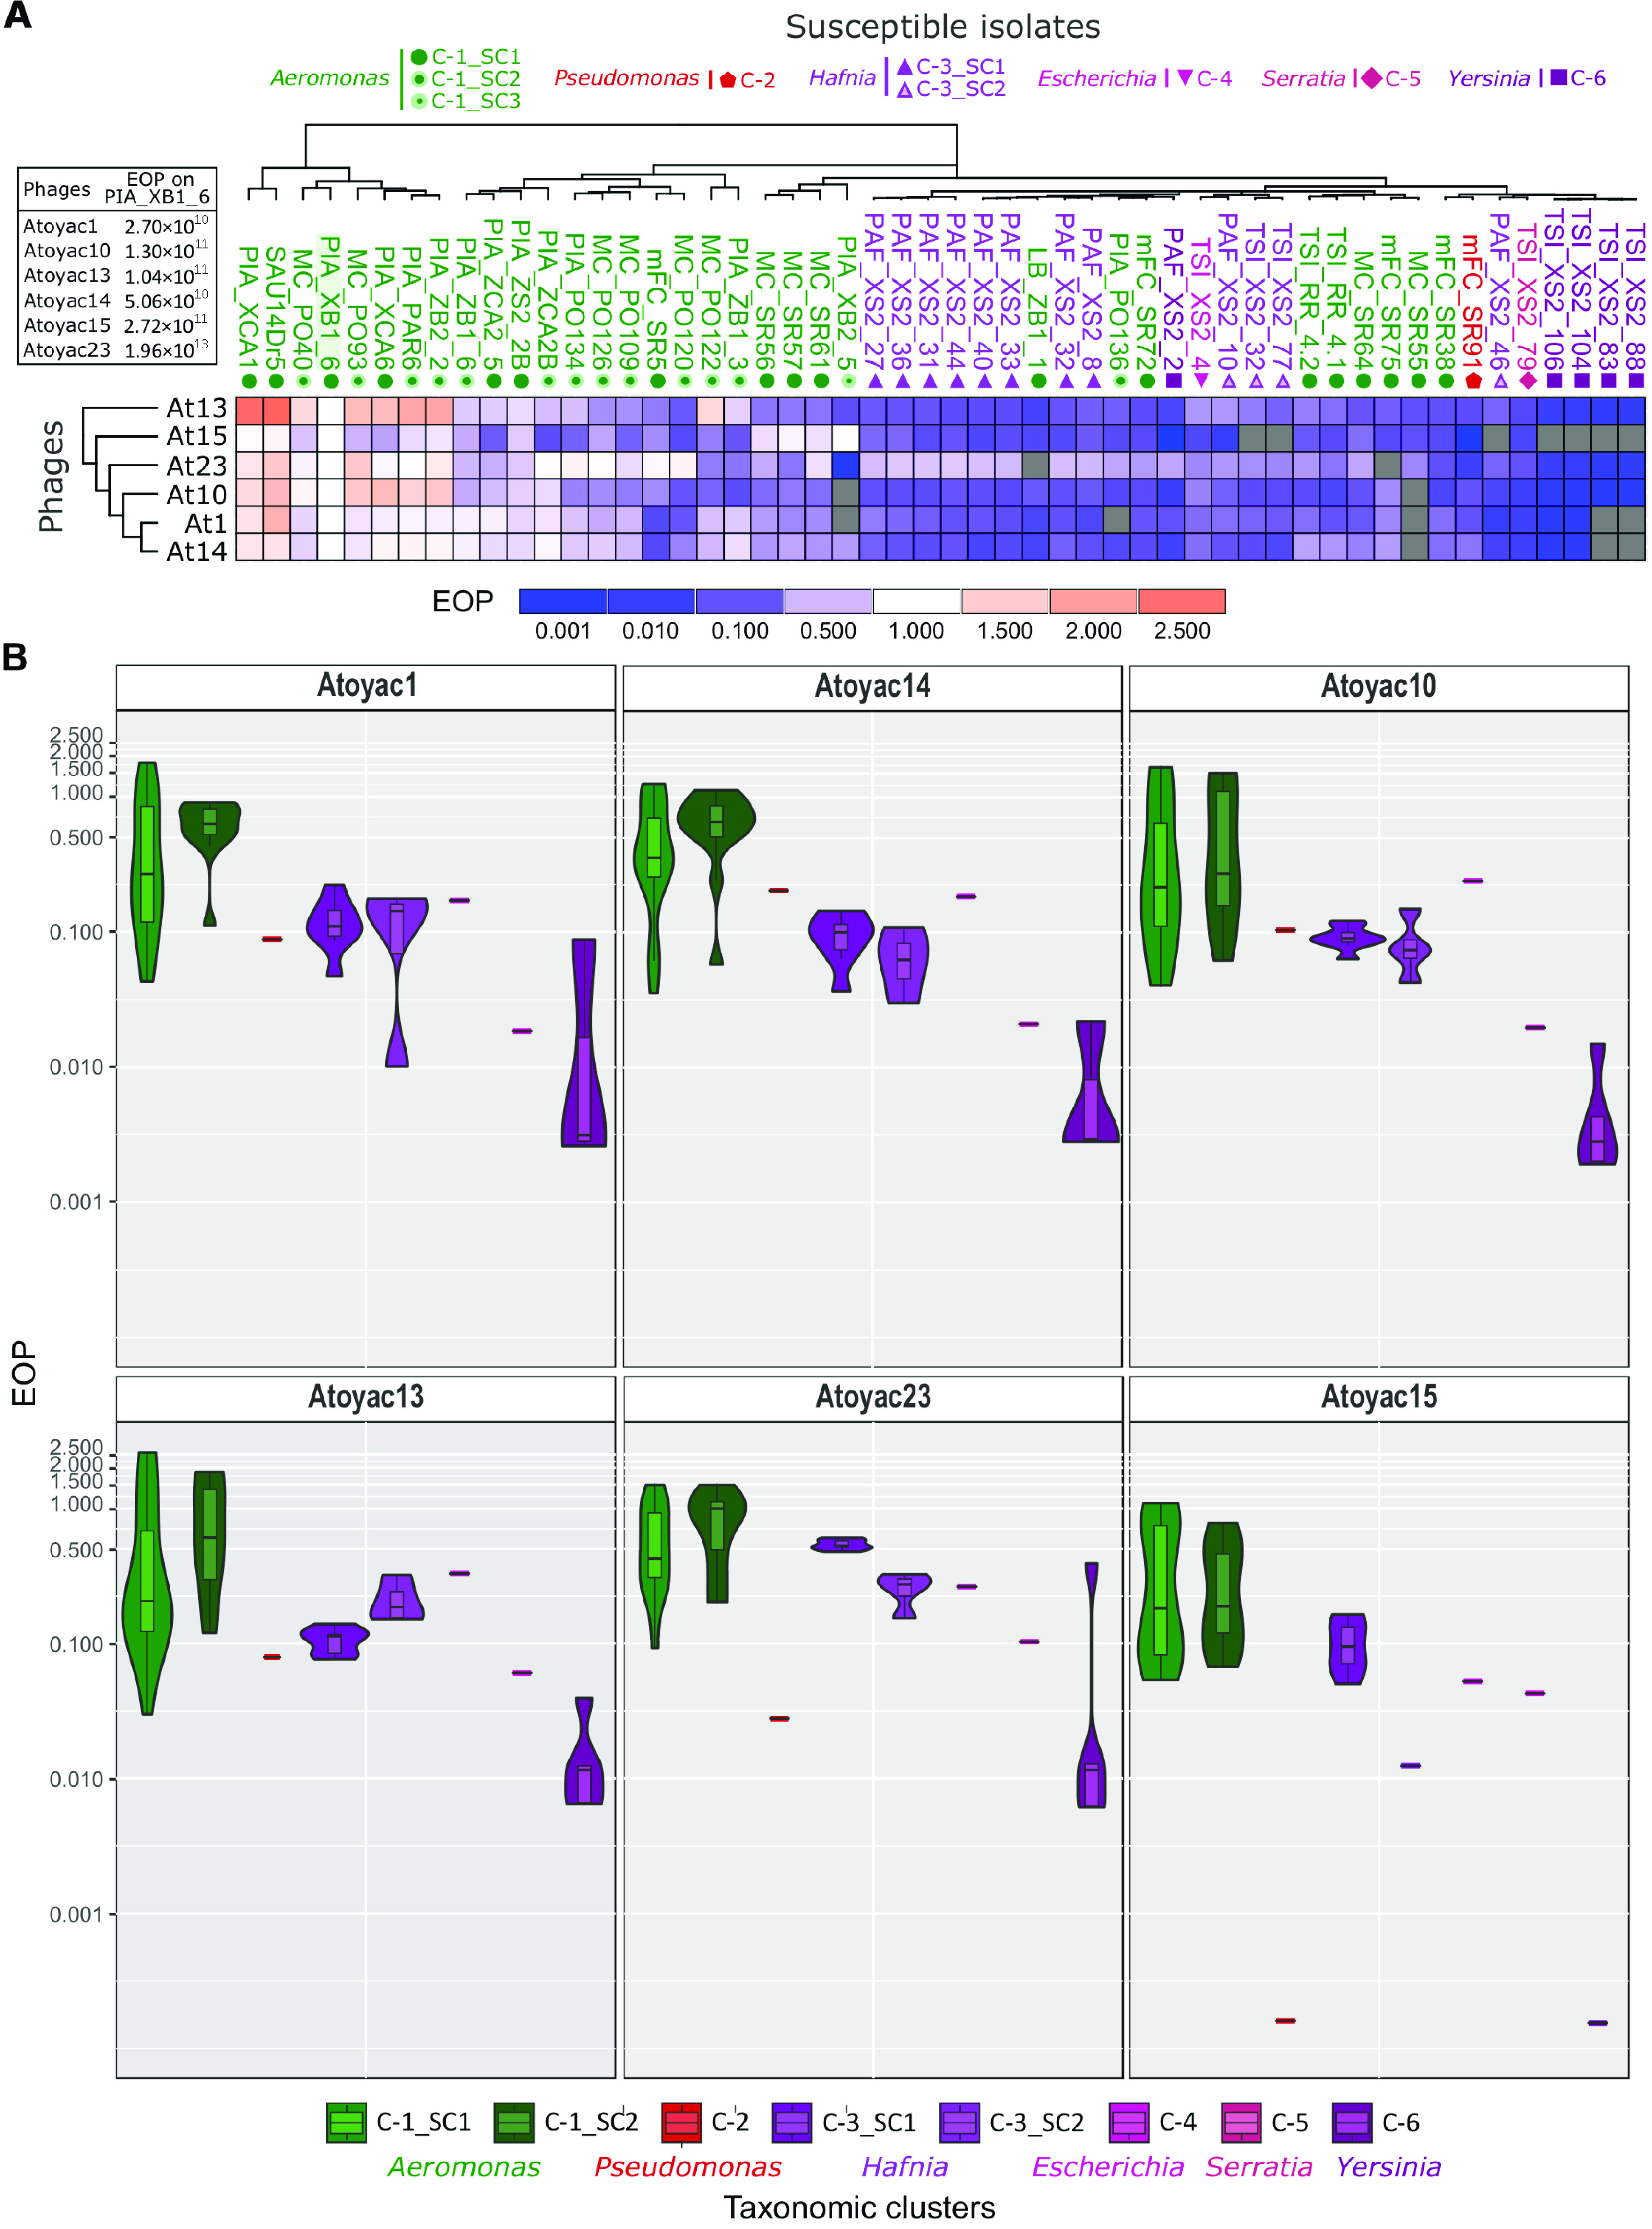
FIG 2.

Host range and efficiency of plating of the Atoyac phages. (A) The heatmap illustrates the efficiency of plating (EOP) recorded for six Atoyac (At) phages (rows) on a panel of 54 environmental strains isolated in this work (columns). Names of the bacterial isolates are color coded according to the taxonomic genus they belong to as indicated at the top of the figure. Symbols below the isolate names indicate the bacterial cluster or subcluster inferred through sequence alignment of a marker gene (see Fig. 1). The titer determined for each phage on the propagating strain PIA_XB1_6 (isolated in this study), indicated in the left inset, was used as the reference value to calculate the EOP. The scale at the bottom of the heatmap depicts the deviation from the EOP recorded in the reference isolate (EOP = 1.0). Gray cells correspond to interactions that did not generate detectable lytic plaques, thus indicating nonsusceptible strains. Both bacterial isolates and phages are hierarchically clustered based on the EOP values using the Euclidean distance method. (B) The EOP values recorded for each Atoyac phage grouped by the taxonomic cluster (genus) or subcluster of their hosts are plotted. Clusters are color coded as in panel A and Fig. 1. The EOP values were calculated from five independent biological replicates, and the averages are plotted. Values in the violin plots are in log scale.
