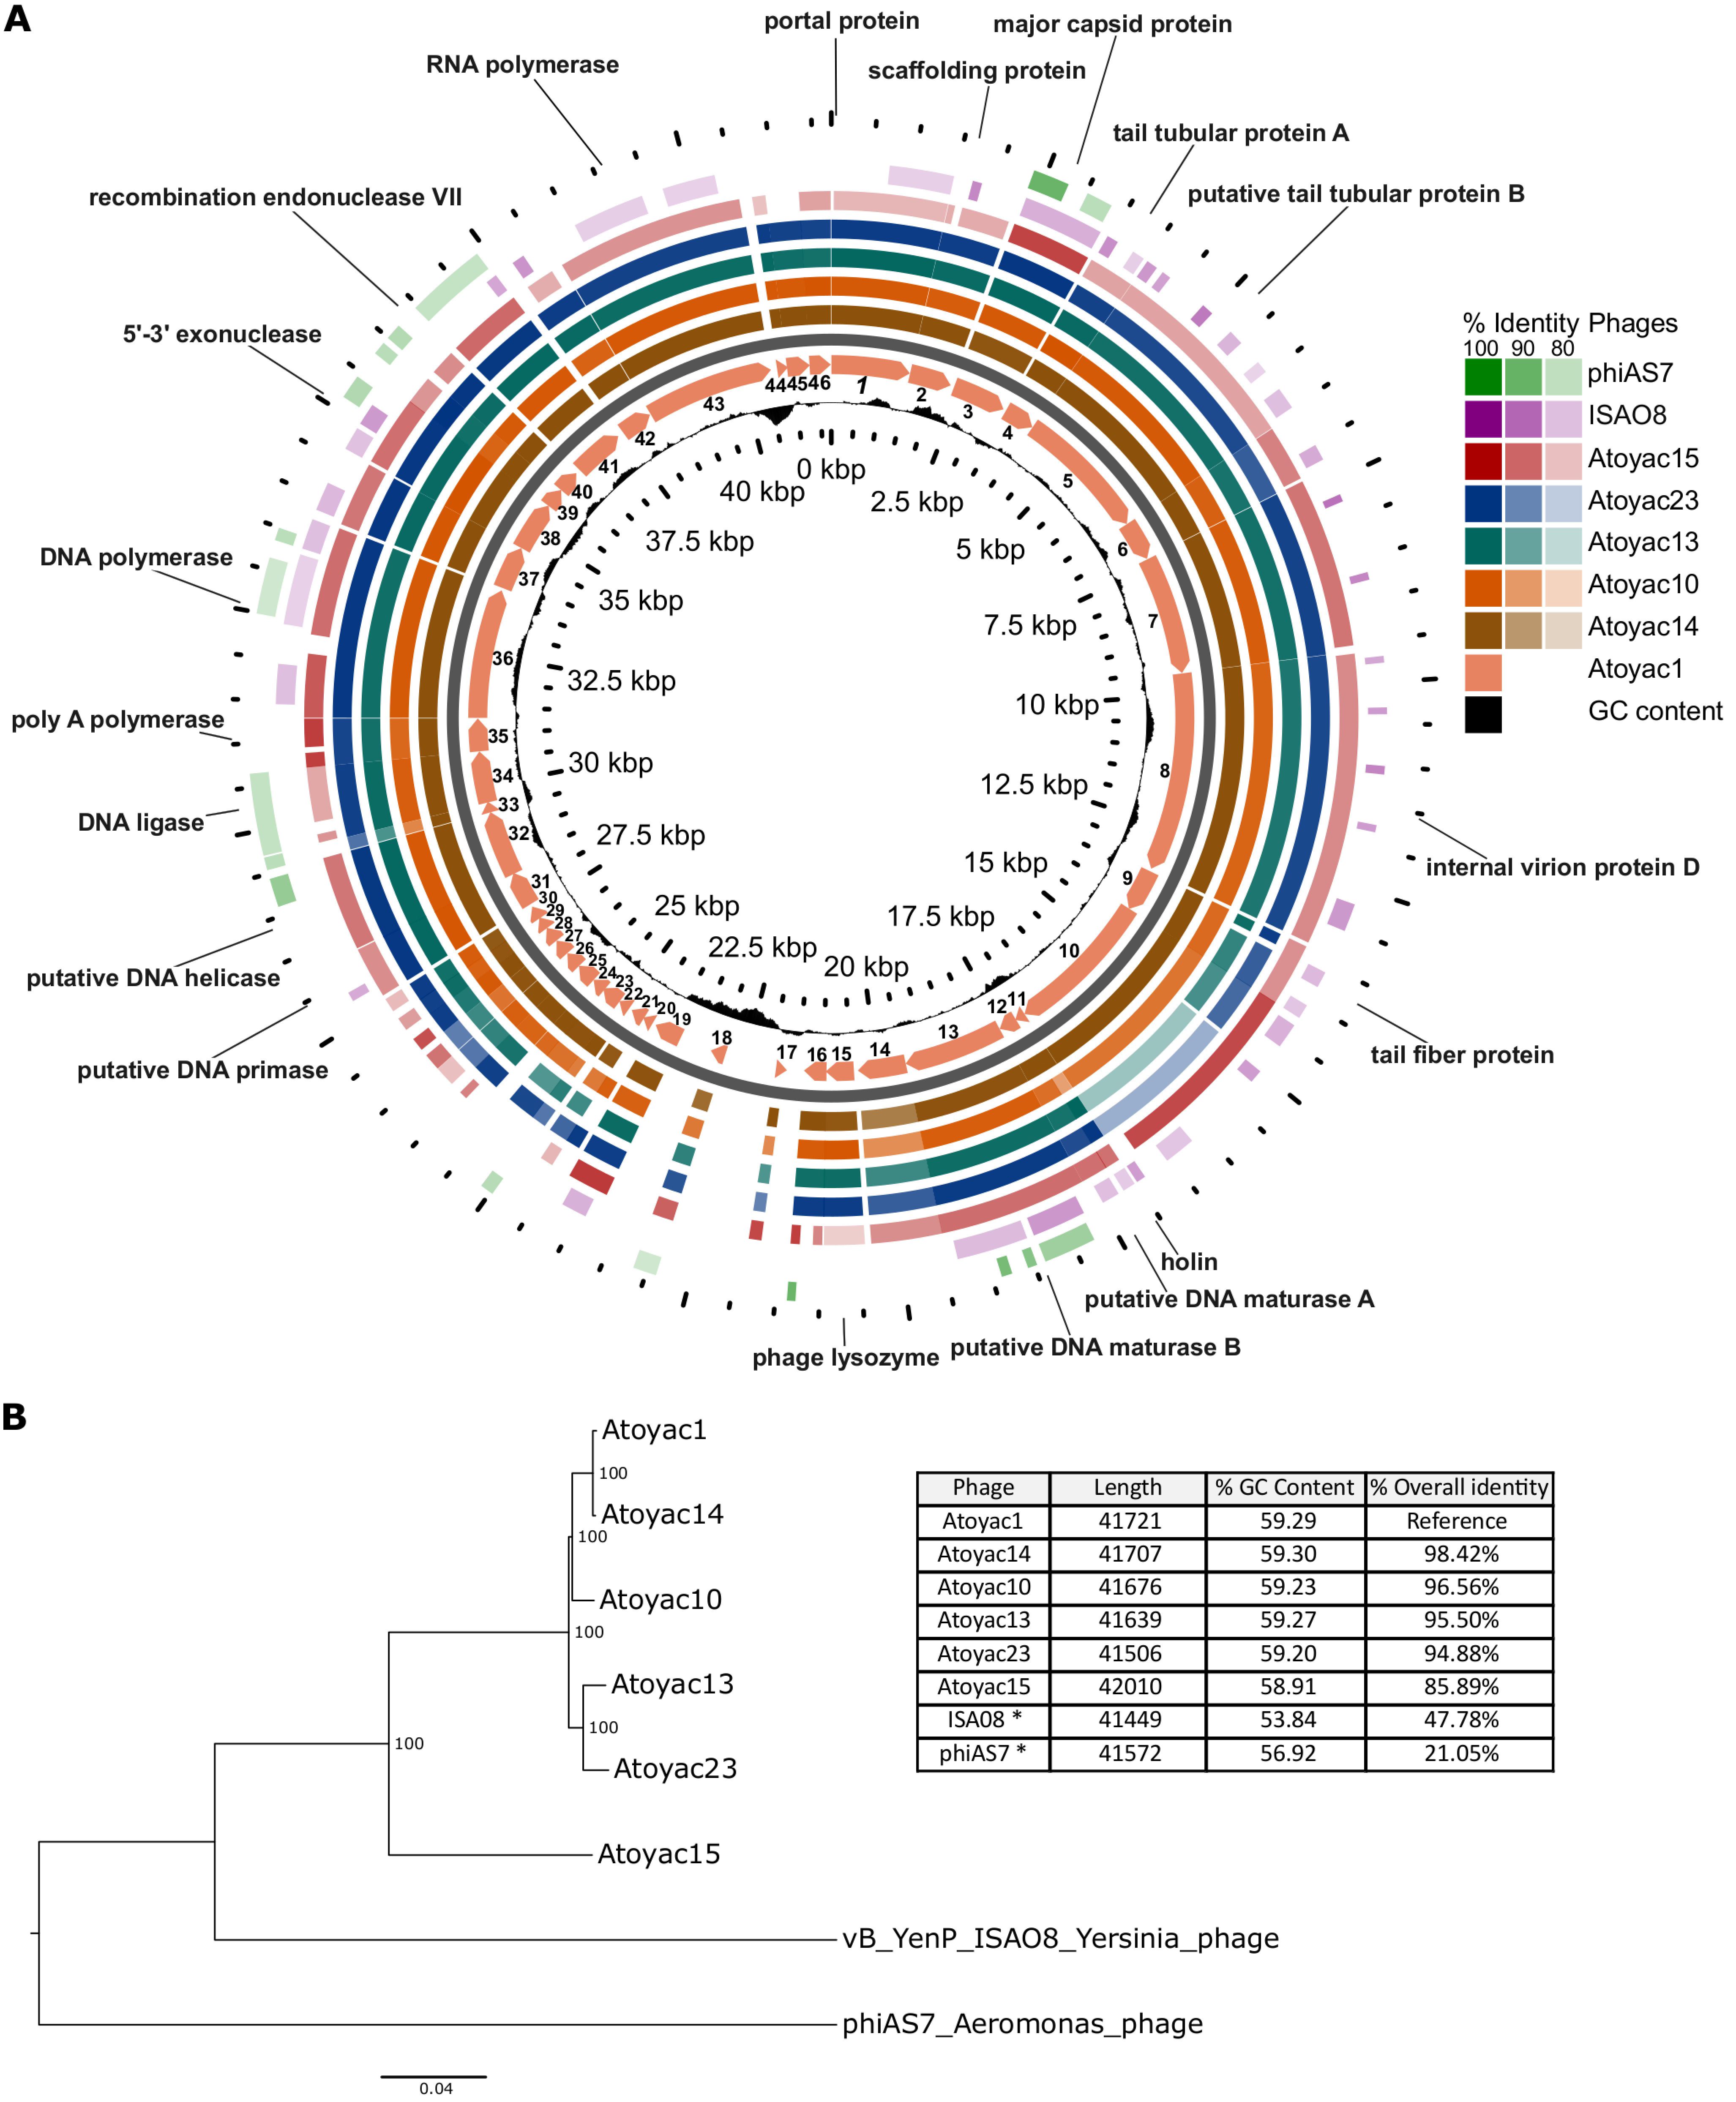
FIG 4.

Genomic comparative analysis and phylogenetics of the Atoyac phage group. (A) The genomes of six Atoyac phages and two distant homologues are represented as color rings and indicated to the right of the figure. The genome of phage Atoyac1, represented by a map in the innermost color ring, was used as a reference to compare the ORF sequences of the other phages at the nucleotide level. Arrows in the map correspond to ORFs pointing toward the direction of their transcription. Functions identified in the genome are indicated outside the rings pointing to the corresponding Atoyac1 ORFs. Coordinates of the reference genome and the distribution of its GC content regarding the average (59%) are indicated inside the corresponding ring. The level of sequence identity detected in the genomes (>79%) respecting the Atoyac1 ORFs is color coded and indicated in the figure. The two outermost rings correspond to representatives of the phage groups displaying the highest sequence similarity to genomes of the Atoyac group. (B) The genomic tree of the Atoyac phages and two distant homologues (neighbor joining) was constructed from the alignment of the genomes at the nucleotide level. The bootstrap support value (100 replicates) of the branches is shown in each node. The overall sequence identity percentage (i.e., over the entire genome length) of Atoyac phages and their distant homologues (marked with an asterisk) regarding phage Atoyac1 (reference) is shown in the table, as well as the length and average GC content of each phage.
