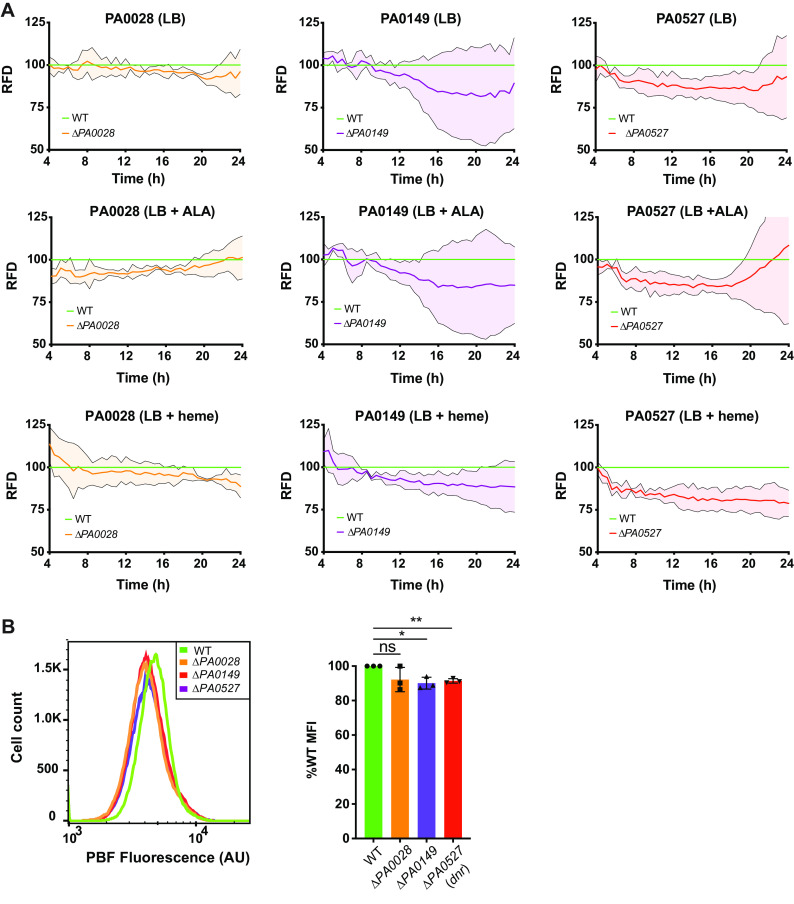
FIG 6.
Assessment of biosensor activity in mutants. (A) Cultures of WT MPAO1 and deletion mutants harboring pIFPHO were grown in either LB, LB plus 50 μg/ml ALA, or LB plus 5 μM hemin. Biosensor expression was induced with the addition of 0.2% arabinose. Absorbance (600 nm) and PBF fluorescence (excitation 675 nm, emission 725 nm) were measured every 30 min for 24 h. The mean fluorescence densities from three biological repeats for PA0028 (orange line), PA0149 (purple line), and dnr/PA0527 (red line) are expressed as percentages of the mean fluorescence density of the WT. RFD, relative fluorescence density. Error bars represent SDs and are depicted above and below the normalized mean lines continuously in a lighter color. (B) Flow cytometric analysis of biosensor-expressing mutants after 14 h of growth in M-56 medium. Cells were fixed with 3% PFA before analysis by flow cytometry. (Left) Representative histogram of PBF fluorescence in each strain. (Right) The mean median fluorescence intensity (MFI) values from three biological repeats are expressed as percentages of the MFI of WT MPAO1. Error bars represent SDs. *, P < 0.05; **, P < 0.01; ns, not significant by a one-sample t test with Wilcoxon test.

