
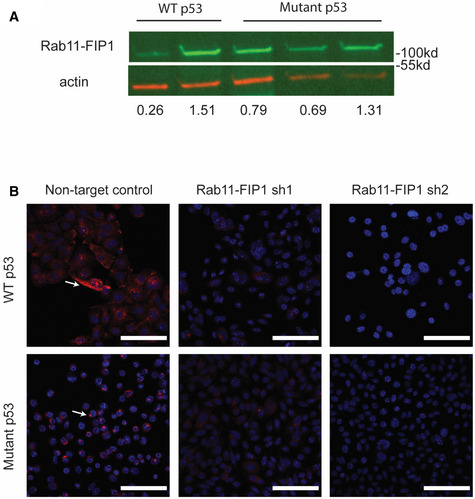
Figure EV2. Expression patterns of Rab11‐FIP1 in WT or Mutant p53 parental or Rab11‐FIP1 depleted cells.
-
ARepresentative Western blot for Rab11‐FIP1 in WT and mutant p53 cell lines relative to actin. Relative intensity densitometry of Rab11‐FIP1 results are shown at bottom.
-
BImmunofluorescent staining for Rab11‐FIP1 (red) in WT and mutant p53 cells expressing non‐target control or Rab11‐FIP1 shRNAs. White arrows indicate Rab11‐FIP1 staining. 40×. Scale bar = 100 μm.