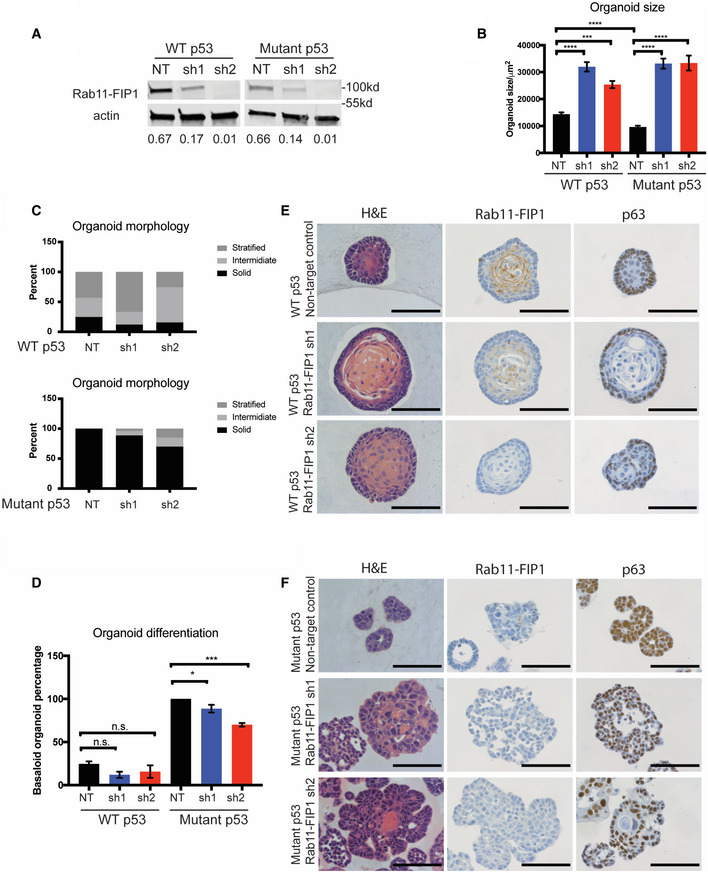
Figure 3. Knockdown of Rab11‐FIP1 promotes epithelial disorganization and increases 3D organoid size.

-
AWestern blot confirming knockdown of Rab11‐FIP1 by shRNAs. Relative intensity by densitometry of Rab11‐FIP1 results are shown at the bottom.
-
B–F3D organoids were generated from WT and mutant p53 cells expressing non‐targeting control (NT) or Rab11‐FIP1 shRNAs (sh1 and sh2). (B) Diameter of organoids (n = 80–130 organoids). Bar graph represents mean diameter ± SEM. ****P < 0.0001 WT or mutant p53 non‐targeting control vs. Rab11‐FIP1 shRNA1, ***P = 0.0006 WT non‐targeting control vs. Rab11‐FIP1 shRNA2, ****P < 0.0001 mutant p53 non‐targeting control vs. Rab11‐FIP1 shRNA2 (one‐way ANOVA). ****P < 0.0001 WT vs. mutant p53 non‐targeting control (Unpaired t‐test). (C) Percent of WT p53 (top panel) and mutant (bottom panel) organoids exhibiting a solid, intermediate, or stratified morphology (n > 50 organoids generated from three different cell passages quantified). (D) Percent of WT p53 and mutant organoids exhibiting a basaloid‐like morphology (n > 50 organoids generated from three different cell passages quantified). Bar graph represents mean diameter ± SEM. n.s. WT p53 non‐targeting control vs. Rab11‐FIP1 shRNAs, *P = 0.046 mutant p53 non‐targeting control vs. Rab11‐FIP1 shRNA1, ***P = 0.0002 mutant p53 non‐targeting control vs. Rab11‐FIP1 shRNA2 (one‐way ANOVA). (E) WT p53 organoids stained for H&E (left), Rab11‐FIP1 (middle), and the basal cell marker p63 (right) by immunohistochemistry (IHC). 40×. Scale bar = 100 μm. (F) Mutant p53 organoids stained for H&E (left), Rab11‐FIP1 (middle), and the basal cell marker p63 (right) by IHC. 40×. Scale bar = 100 μm.
Source data are available online for this figure.
