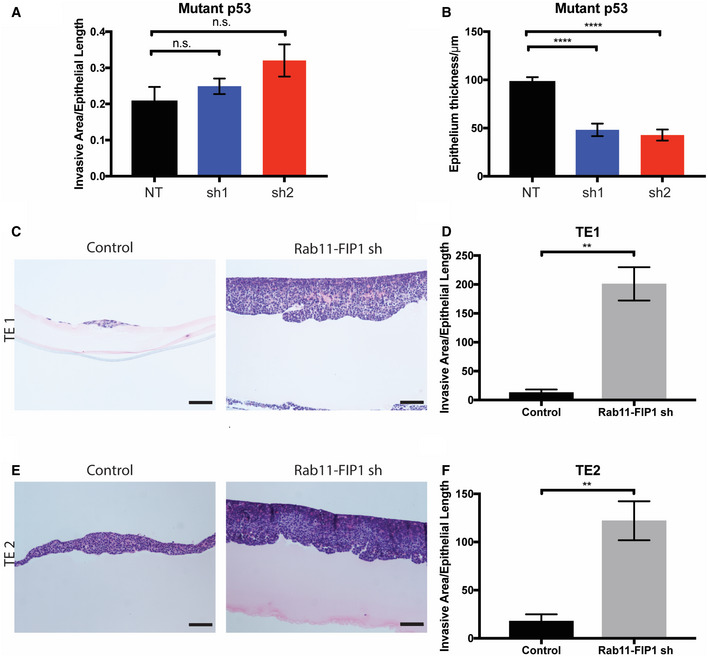
Figure EV3. The effects of Rab11‐FIP1 upon invasion in 3D organotypic cultures of murine mutant p53 cells and human ESCC cells.

-
ARelative invasive area from OTC of mutant p53 non‐target control and Rab11‐FIP1 shRNAs. n = 6 technical replicates in mutant p53 NT, sh1 and sh2 OTC. n.s. Mutant p53 NT vs. sh1, Mutant p53 NT vs. sh2 (one‐way ANOVA).
-
BEpithelial thickness quantification from OTC of mutant p53 non‐target control and Rab11‐FIP1 shRNAs. n = 6 technical replicates in mutant p53 NT, sh1, and sh2 OTC. Error bars represent ± SEM. ****Mutant p53 NT vs. sh1, Mutant p53 NT vs. sh2, P < 0.0001 (one‐way ANOVA).
-
C–F(C, E) TE1 and TE2 cells expressing control or Rab11‐FIP1 shRNA were grown in OTC. Scale bar = 100 μm. (D, F) Graphs show relative invasive area from OTC of TE1 and TE2 cells expressing control or Rab11‐FIP1 shRNA. Error bars represent ± SEM. TE1 n = 3 technical replicates in TE1 control and shRNA **P = 0.030, TE2 n = 3 technical replicates in TE1 control and shRNA **P = 0.0082 (Unpaired t‐test).
