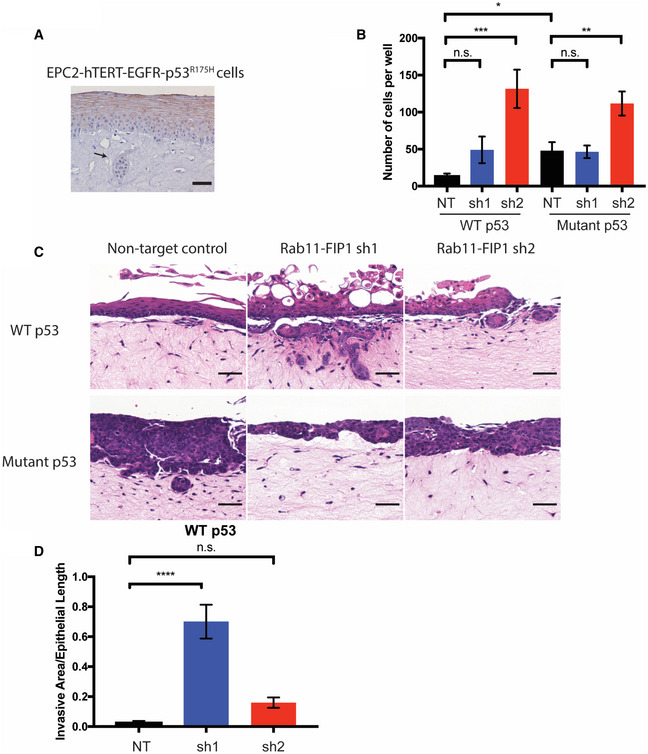
Figure 4. Loss of Rab11‐FIP1 promotes mutant p53 driven invasion.

-
AEPC2‐hTERT‐EGFR‐p53R175H cells grown in OTC stained for RCP. Arrow indicates invasive region (scale bar = 100 μm).
-
BTranswell Boyden Chamber invasion assay of WT and mutant p53 cells expressing non‐targeting control (NT) and Rab11‐FIP1 shRNAs (sh1 and sh2; n = 6 technical replicates for WT p53 NT, n = 9 technical replicates for other groups from three different passages). Error bars represent ± SEM. n.s. WT p53 NT vs. sh1, ***P = 0.0005 WT p53 NT vs. sh2, n.s. Mutant p53 NT vs. sh1, **P = 0.0026 Mutant p53 NT vs. sh2, (one‐way ANOVA) *P = 0.0173 WT p53 NT vs. Mutant p53 NT, (unpaired t‐test).
-
C, DWT and mutant p53 cells expressing non‐target control and Rab11‐FIP1 shRNAs were grown in OTC. C. H&E staining of OTC with WT p53 (top) and mutant p53 (bottom) with invasive regions. Scale bar = 50 μm. D. Graph shows relative invasive area from OTC of WT p53 non‐target control and Rab11‐FIP1 shRNAs. n = 5 technical replicates in WT p53 NT, n = 6 technical replicates in WT p53 sh1, n = 6 technical replicates in WT p53 sh2. Error bars represent ± SEM. ****P < 0.0001 WT p53 NT vs. sh1, n.s. WT p53 NT vs. sh2 (one‐way ANOVA).
