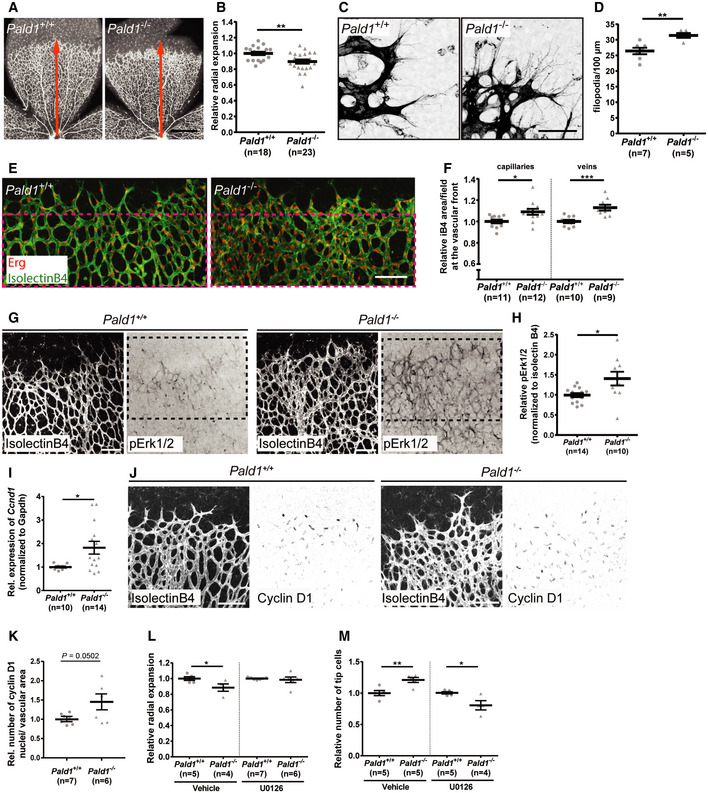
Figure 4. Retinal vascular phenotype in Pald1 −/− mouse.

-
A, BDelayed vascular outgrowth and hyperdense vascular front in isolectinB4‐stained P5 retina from Pald1 −/− mouse compared with Pald1 +/+ (A). Orange arrow indicates radial expansion of the vascular plexus in the Pald1 +/+ retina as a reference. Scale bar: 1 mm. Quantification of radial expansion (B) as shown in (A) normalized to wild‐type litter mates. Mean ± SEM, unpaired t‐test. n = 14 litters, 18 wild type, and 23 knockout pups.
-
C, DIncreased filopodia number in Pald1 −/− mouse retina at vascular front, visualized by isolectinB4 staining (C). Scale bar: 50 μm. Quantification of filopodia per 100 µm at the vascular front (D). Mean ± SEM, unpaired t‐test. n = 3 litters, 7 wild type, and 5 knockout pups.
-
E, FP5 retina vascular front (isolectinB4, green) and endothelial nuclei (Erg, red) (E). Scale bar: 100 μm. Magenta stippled square area quantified in (F). Vascular density was determined in the capillary bed (left) (11 wild type, 12 knockout) and in area around veins (right) (10 wild type, 9 knockout, biological replicates). Mean ± SEM, unpaired t‐test.
-
G, HIsolectinB4 (white) visualizes the entire vasculature. pT202/pY204 Erk1/2 immunostaining (black) in Pald1+/+ and Pald1 −/− P5 pups. Scale bar: 100 μm. Quantification of pT202/pY204 Erk1/2 area (H) as in the black stippled square in (G) (400 µm from the retina rim), normalized to isolectinB4 area. Mean ± SEM, unpaired t‐test. n = 5 litters, 14 wild type, and 10 knockout retinas per genotype.
-
IQuantitative real‐time PCR analysis of P4‐P5 retinas from Pald1+/+ and Pald1 −/− pups. Ccnd1 transcript levels, normalized to Gapdh. Mean ± SEM, unpaired t‐test. n = 10 Pald1 +/+ and 14 Pald1 −/− pups.
-
JIsolectinB4 (white) and Cyclin D1 (black) staining of P5 retinas from Pald1+/+ and Pald1 −/−pups. Scale bar: 100 µm.
-
KQuantification of the number of Cyclin D1‐positive nuclei normalized for isolectinB4 area in retinas from Pald1+/+ and Pald1‐/ P5 pups. Mean ± SEM, unpaired t‐test. n = 7 Pald1 +/+ and 6 Pald1 −/− pups.
-
LQuantification of relative radial expansion in vehicle (n = 2 litters, 5 Pald1 +/+ and 4 Pald1 −/− pups) and MEK inhibitor (U0126)‐treated pups (n = 4 litters, 7 Pald1 +/+ and 5 Pald1 −/− pups). MEK inhibitor/vehicle was administered twice at 12‐h interval at P4 and eyes collected at P5. Each dot is one mouse. Mean ± SEM, one‐way ANOVA, n = 4–7.
-
MQuantification of the tip cell number in vehicle‐ (n = 3 litters, 5 Pald1 +/+ and 5 Pald1 −/− pups) and MEK inhibitor (U0126)‐treated pups (n = 3 litters, 5 Pald1 +/+ and 4 Pald1 −/− pups). MEK inhibitor/vehicle administered twice at P5 at 2‐h intervals, and eyes collected 2 h after the second injection. Each dot is one mouse. Mean ± SEM, one‐way ANOVA.
Data information: *P < 0.05, **P < 0.01, ***P < 0.001.
Source data are available online for this figure.
