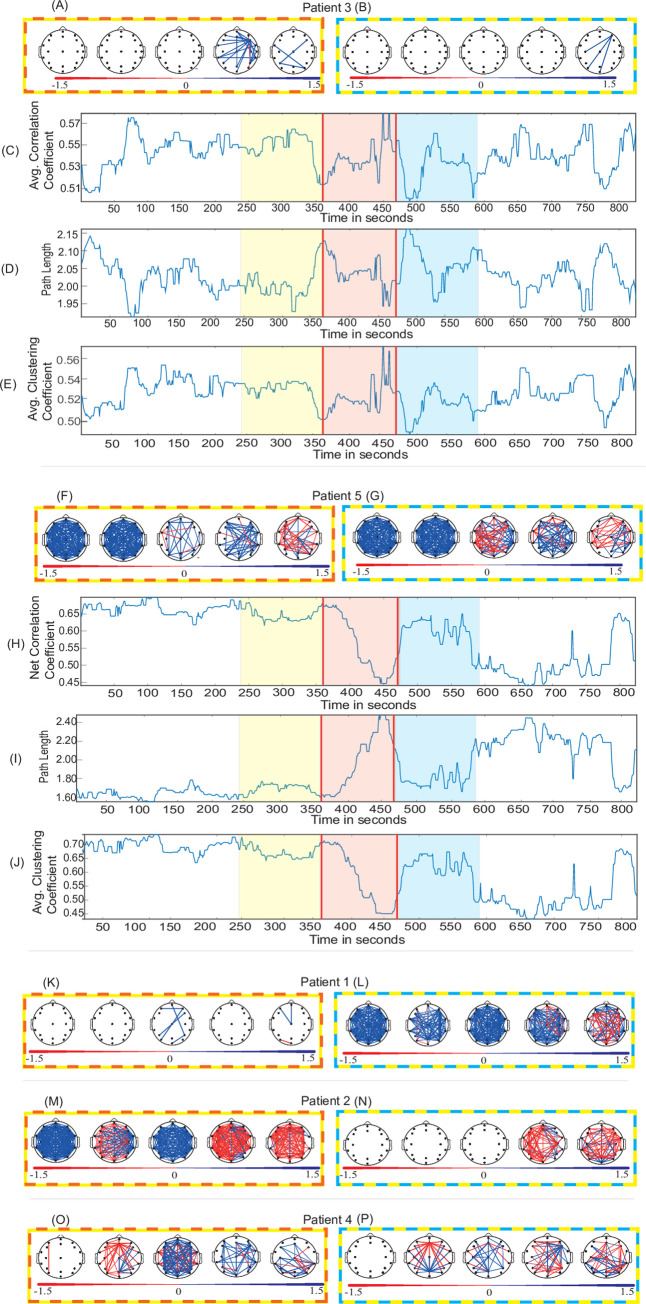
Fig 3. Functional connectivity and graph-theory analysis.
(A, F, K, M, O) Effect sizes (Cohen’s d) of the functional connectivity change of “before-during” and (B, G, L, N, P) “before-after” for five Patients. (C, H) Time series of net (average) correlation coefficient in broadband (1-70Hz) for Patient 3 and Patient 5. (D, I) Time series of the net (average) path length in broadband (1-70Hz) for Patient 3 and Patient 5. (E, J) Time series of the net (average) clustering coefficient in broadband (1-70Hz) for Patient 3 and Patient 5. Positive effect size denotes decrement in functional connectivity. Topographical maps are ordered as delta, theta, alpha, beta and gamma. The frames surrounding topographical maps signify difference in the respective states they are representing. For instance, Fig 3C has yellow, red, and blue colours over laid across before, during, and after epochs respectively and topographical maps in Fig 3A has “yellow-red” colour frame representing the effect size between “before-during” states.

