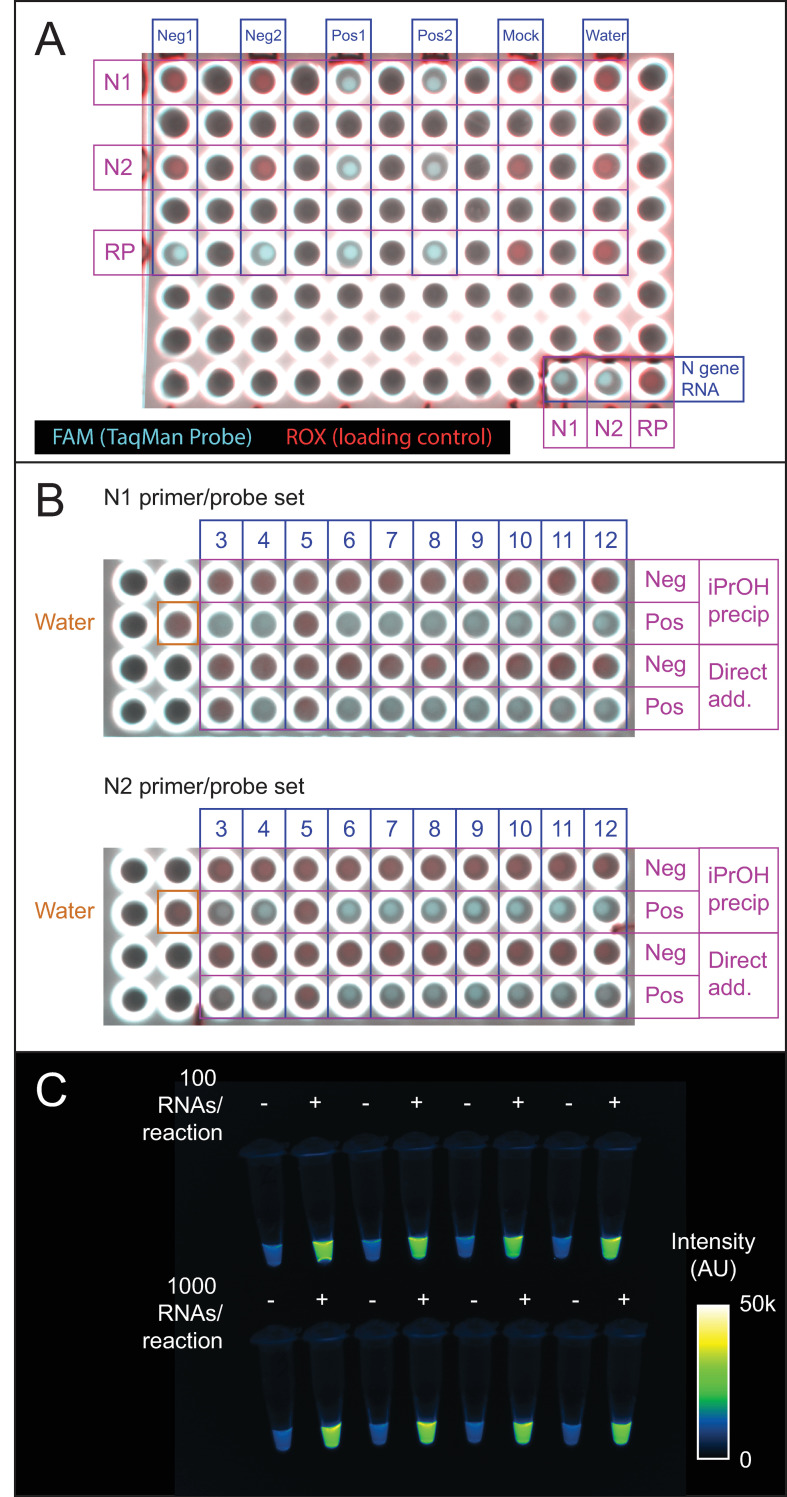
Fig 7. Endpoint fluorescence detection.
(A) Endpoint fluorescence image of the qPCR plate used for the first two clinical samples in Fig 1B and 1C. Shown is a 2-channel overlay in which the ROX control dye in TaqPath master mix appears in the rhodamine channel (red) and dequenched FAM product from the TaqMan probe appears in the fluorescein (cyan) channel. An N gene RNA positive control is in the lower right-hand corner. Positive and negative samples are clearly distinguishable based on fluorescence in the FAM channel. Note that leaving empty spaces between samples was an arbitrary choice. B) BioRad Chemidoc fluorescence image of the qPCR plate used for the IPA precipitation and direct addition reactions in Fig 1B, 1C and 2B. Positive and negative samples distinguishable by qPCR are also distinguishable by endpoint fluorescence imaging. Red, rhodamine (0.5 s exposure). Cyan, fluorescein (0.05 s exposure). Scale is set from 0 to 55000 counts for each channel. C) Endpoint detection using the N2 probe set and BEARmix. Reactions were set up in alternating tubes with water (negative control) or in vitro-transcribed N gene RNA at 100 or 1000 copies per reaction. An image taken with a 0.1 s exposure time in the fluorescein channel of a ChemiDoc imager (BioRad) is displayed using the Fiji "Green Fire Blue" colormap with lower and upper limits set to 0 and 50000.

