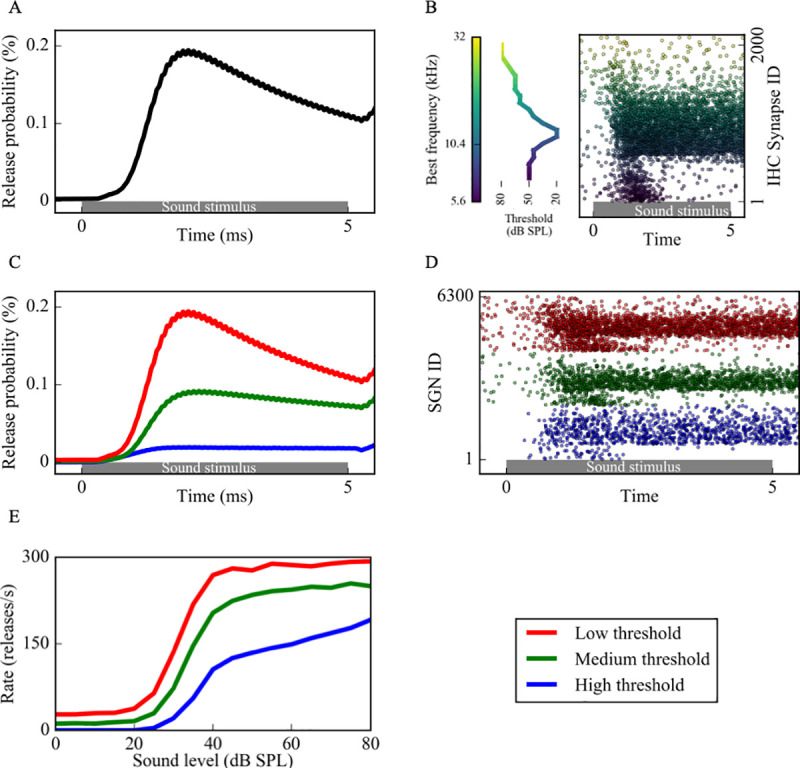
Fig 2. Sound-evoked activity of low, medium and high threshold SGN fibers resulting from increased vesicle release probabilities from corresponding IHC-SGN synapses.

(A) Sound stimuli increased vesicle release probability from IHCs (as computed using the coupled (Eqs 12–22)) and release times were determined by a Poisson process. (B) Cumulative release events of an IHC synapse population with best frequencies (BFs) between 5.6kHz-32kHz in response to a 10kHz sound stimulus (right). The dots, color coded based on the BFs of the synapses, represent release times at each IHC synapse in a population of 2000. Since the thresholds of IHCs depend on their BFs (left), each synapse has a different release pattern. For each release event, the associated SGN fiber is stimulated with a brief external current pulse, resulting in spiking activity. (C) Three groups of SGN fibers, low (LT), medium (MT) and high (HT) threshold, were simulated based on their spontaneous firing rates and saturation profiles in response to sound. (D) Based on the release probabilities, different fiber types exhibit different cumulative responses (red dots: low threshold, green dots: medium threshold, blue dots: high threshold). Panels A-D are example simulations for simulated 80dB SPL 10kHz sound stimuli. (E) The increase in spike rates of simulated fiber type in response to increasing sound levels is comparable to Fig 3 of [12].
