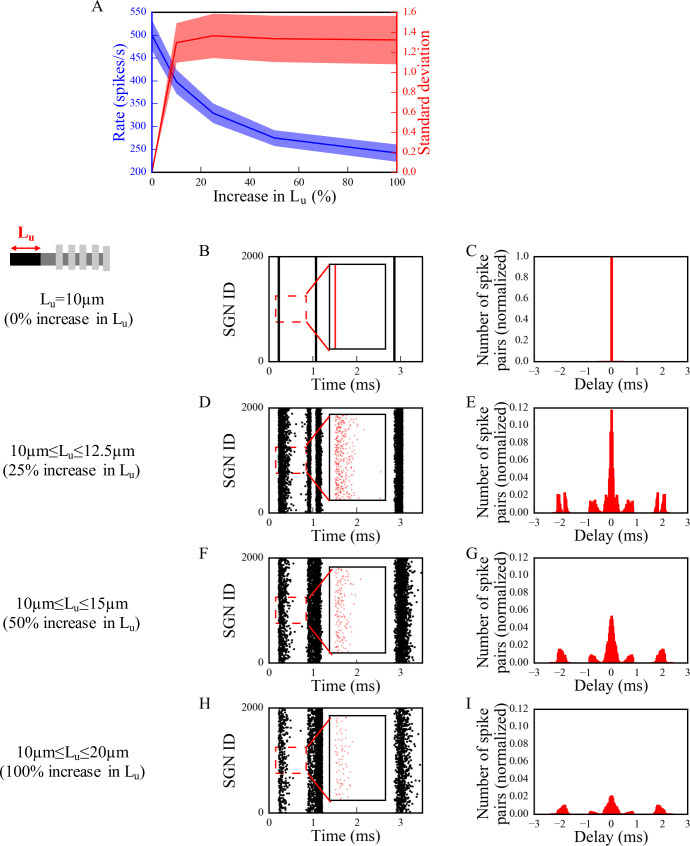
Fig 4. The synchronous activity of SGN fiber populations is disrupted and their response to sound is decreased with increasing levels of Lu heterogeneity.
SGN fiber populations with different heterogeneity levels of Lu were stimulated with 80dB sound stimulus at 0ms. We assumed release events from all IHCs for the population occurred simultaneously. Firing rate and standard deviations of time intervals are averaged for all populations in (A), shaded area represents the standard error of the mean. Raster plots [(B), (D), (F) and (H), insets: the first bursts of the raster plots] and corresponding histograms of time intervals between non-identical pairs of spike trains within a population normalized to the total number of spike pairs in panel B [(C), (E), (G) and (I)] are shown for populations of SGN fibers with Lu = 10μm (0% increase in Lu) [(B) and (C)], 10μm≤Lu≤12.5μm (25% increase in Lu) [(D) and (E)], 10μm≤Lu≤15μm (50% increase in Lu) [(F) and (G)] and 10μm≤ Lu≤20μm (100% increase in Lu) [(H) and (I)]. The ordinates of the histograms are normalized over the number of spike pairs with 0ms delay for the population where all fibers have Lu = 10μm (C). Simulations were done 10 times.

