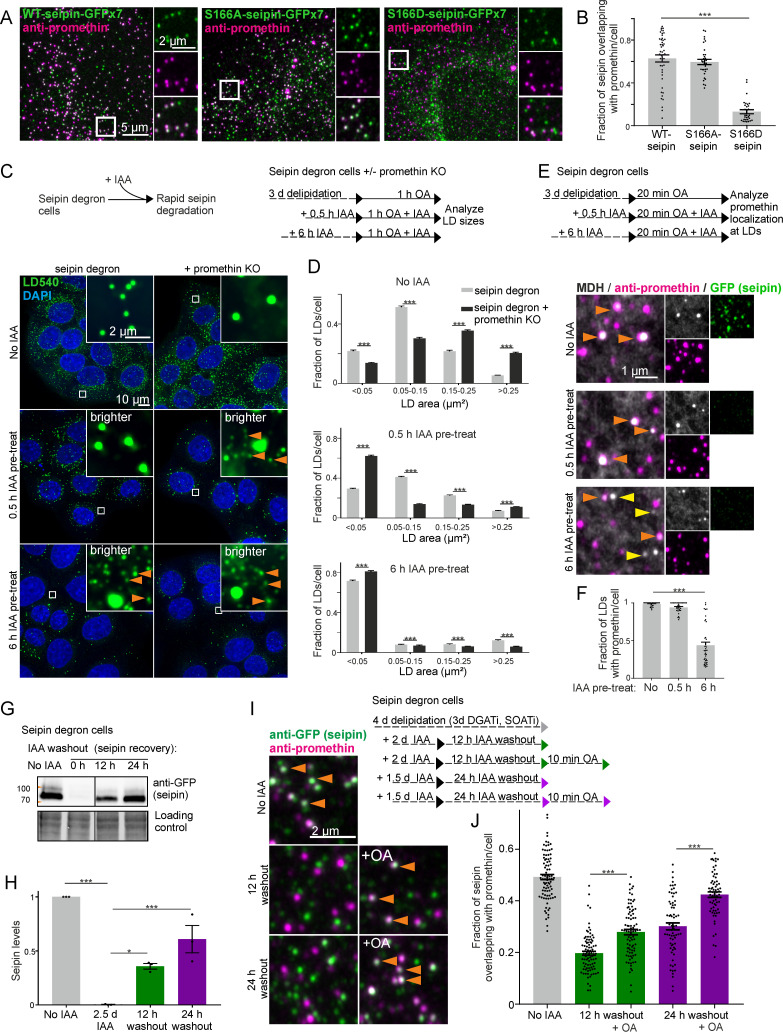
Fig 3. Promethin sensitizes cells to seipin depletion, and TAG facilitates nascent seipin association with promethin.
(A) A431 seipin KO cells stably expressing indicated plasmids were fixed and stained with anti-promethin antibodies. (B) Analysis of (A). Bars: mean ± SEM, n ≥ 30 cells/group, 3–4 experiments. Statistics: Kruskal–Wallis test followed by Dunn’s test, comparing to WT-seipin. (C) Seipin degron cells with or without promethin KO were delipidated for 3 d, treated with IAA and 200 μM OA as indicated, fixed, stained, and imaged by widefield microscopy. Deconvolved maximum intensity projections of z-stacks. Orange arrowheads: tiny LDs. Note that 0.5-h IAA pretreatment is sufficient to induce generation of tiny LDs in promethin KO cells. (D) Analysis of (C). Bars: mean ± SEM, n > 500 cells/group, 3 experiments. Promethin KO data are pooled from 2 KO pools. Statistics: Mann–Whitney test. (E) Seipin degron cells were delipidated for 3 d, including the last 18 h in the presence of DGAT inhibitors. Cells were treated with IAA as indicated. The inhibitors were washed out, and cells were treated with 200 μM OA, fixed, stained with anti-promethin antibodies and MDH, and imaged by Airyscan microscopy. Crops of maximum intensity projections of Airyscan z-stacks. Orange arrowheads: LDs with promethin signal; yellow arrowheads: LDs without promethin signal. (F) Analysis of (E). Bars: mean ± SEM, n ≥ 29 cells/group, 2 experiments. Statistics: Kruskal–Wallis test followed by Dunn’s test, comparing to no IAA treatment. (G) Immunoblot of seipin levels in seipin degron cells after IAA washout as indicated. Note the recovery of seipin levels upon IAA washout. (H) Analysis of (G). Bars: mean ± SEM, n = 3 biological replicates from 2 experiments. Statistics: 1-way ANOVA followed by Tukey’s post hoc test. (I) Seipin degron cells were delipidated and treated with IAA and OA as indicated. DGAT and SOAT inhibitors were washed out prior to OA addition. Cells were fixed, stained with antibodies, and imaged. Crops from maximum projections of Airyscan z-stacks. Orange arrowheads: seipin foci overlapping with promethin. (J) Analysis of (I). Bars: mean ± SEM, n > 60 cells/group. Data are pooled from 4 experiments, 2 using anti-GFP and 2 using anti-degron tag antibodies for seipin detection. Statistics: Kruskal–Wallis test followed by Dunn’s test. Numerical values for the graphs in (B), (D), (F), (H), and (J) can be found in S1 Data. DGATi, DGAT inhibitor; ER, endoplasmic reticulum; IAA, indole-3-acetic acid; KO, knockout; LD, lipid droplet; MDH, monodansylpentane; mol%, mole percent; OA, oleic acid; SOATi, SOAT inhibitor; TAG, triacylglycerol; WT, wild-type.

