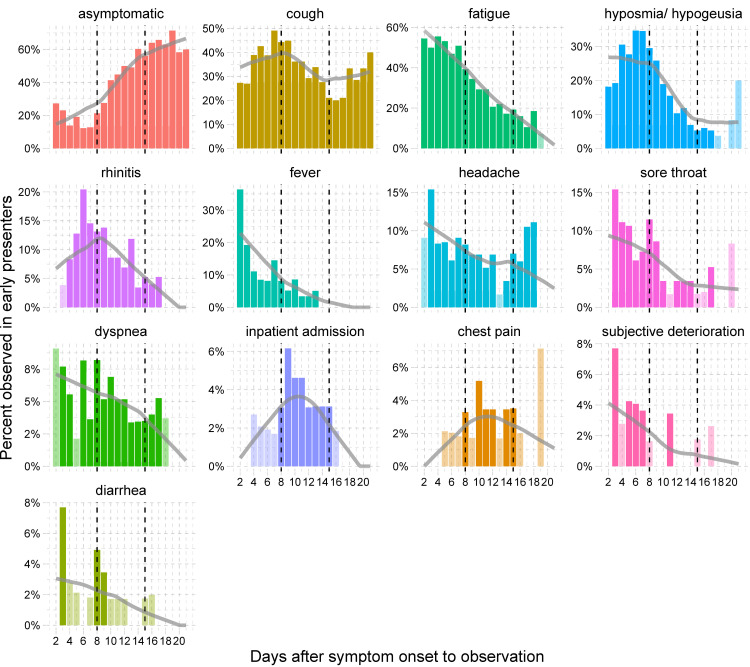
Fig 4. Time-course of symptoms observed for early presenters patients (≤ 7 days from symptom onset to testing) (n = 65).
Observations are arranged by frequency. Dashed lines indicate the start of the second and third week after symptom onset. Bars in lighter color represent observations, where only a single patient developed a specific symptom. Grey trend lines are trends calculated as loess-smoother.

